Figure 3.
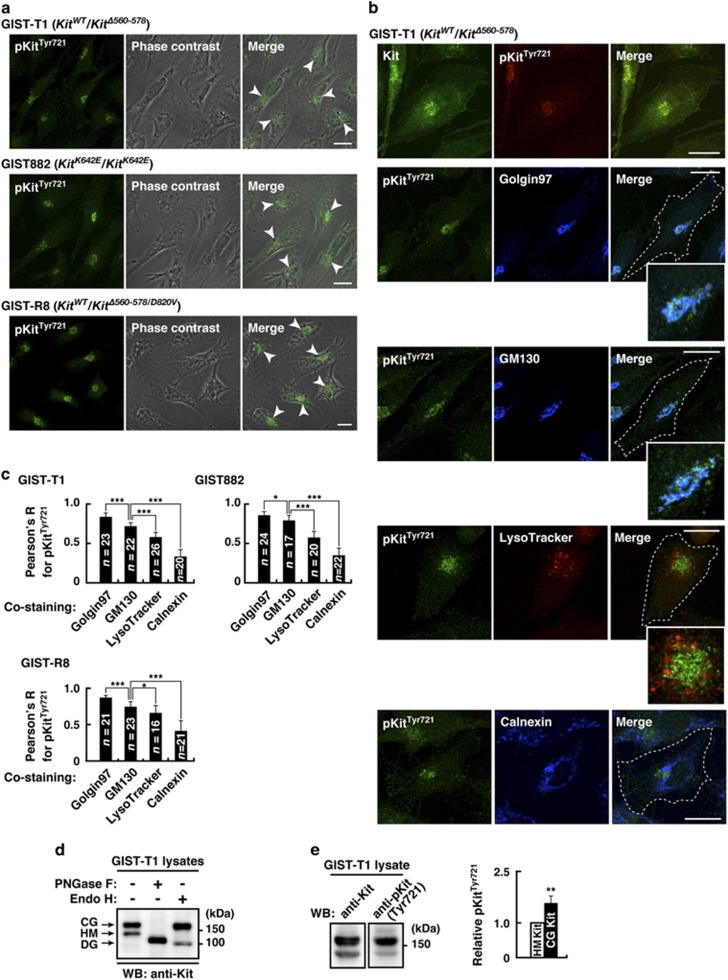
In GIST cells, Kit’s autophosphorylation occurs mainly on the Golgi apparatus. (a) GIST-T1, GIST882 and GIST-R8 were immuno-stained with anti-pKitTyr721. Phase contrast images are shown. Arrowheads indicate the perinuclear region. Bars, 20 μm. pKitTyr721, phosphorylation at Tyr721 in Kit. (b) GIST-T1 cells were stained with anti-pKitTyr721 in conjunction with the indicated antibody. Golgin97 (trans-Golgi marker), blue; GM130, (cis-Golgi marker), blue; calnexin (ER marker), blue. Lysosomes were visualized with LysoTracker Red. Insets show magnified images of the perinuclear region. Dashed lines indicate cell borders. Bars, 20 μm. (c) Pearson’s R correlation coefficients were calculated from intensity analysis of pKitTyr721 vs organelle markers. Results are means±s.d. (n=16–26). *P<0.05, ***P<0.001. (d) Lysates from GIST-T1 were treated with peptide N-glycosidase F (PNGase F) or endoglycosidase H (endo H) then immunoblotted. CG, complex-glycosylated form; HM, high mannose form; DG, deglycosylated form. (e) Levels of phosphorylation of the complex-glycosylated form of Kit are expressed relative to those of the high mannose form of Kit. Results are means±s.d. (n=3). **P<0.01.

