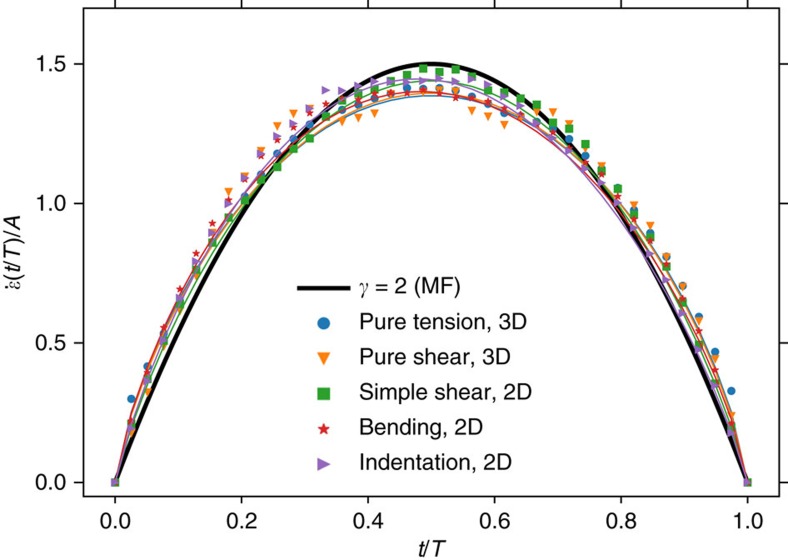
Figure 5. Scaling of average avalanche signal for fixed duration T.
Simulations are consistent with γ=1.8 and inconsistent with mean-field theory. The signal has been averaged over avalanche realizations for durations T=40, 100, 105, 110, …, 200, 250 and the mean signal for each T is normalized so the area under the curve  is unity before averaging over durations. Lines are fits using (7); fitted parameters are reported in Supplementary Table 2.

