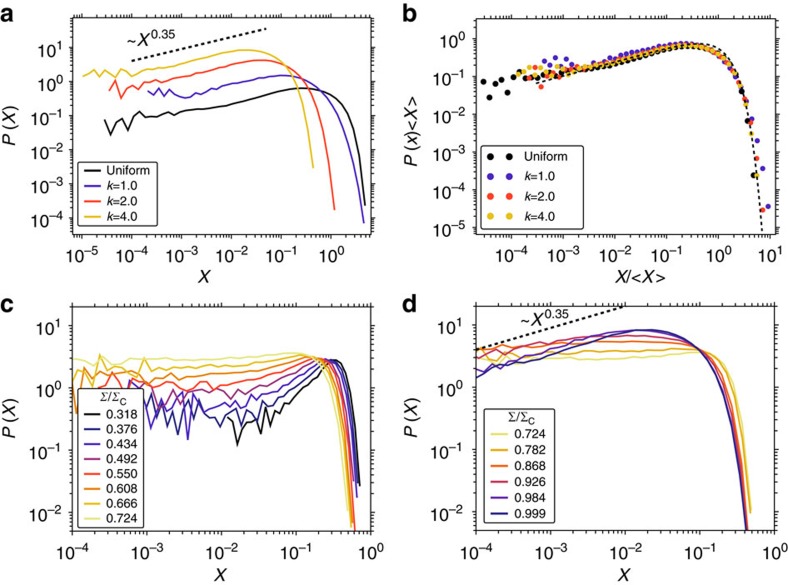
Figure 8. Local stability distributions evolve non-monotonically.
The evolution yields an exponent θ=0.35 at the critical point regardless of yield threshold distribution P(Σt). Panel (a) shows local stability distributions at the critical stress, obtained from systems with P(Σt) a Weibull distribution with exponents k=1, 2 and 4 as well as from uniformly distributed Σt∈[0, 1). In all cases, 〈Σt〉=0.5. Panel (b) shows the same stability distributions renormalized as X→X/〈X〉 and fit by a Weibull distribution of exponent k=θ+1=1.35 (dashed black line). Panels (c,d) show the local stability distribution in the course of loading for simulations with P(Σt) Weibull distributed with k=4: (c) shows the evolution from stress Σ=0 to Σ=0.724ΣC, (d) the evolution from stress Σ=0.724ΣC to Σ=0.999ΣC.

