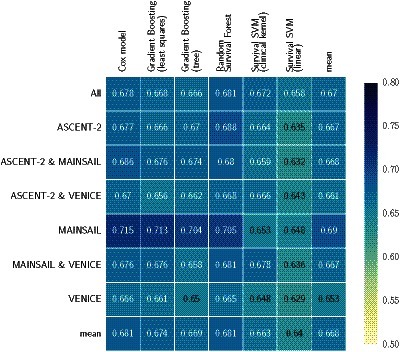
Figure 2. Cross-validation performance of survival models on data from from the ASCENT-2, VENICE, and MAINSAIL trial, as well as any combination of these datasets.

The last column (mean) denotes the average performance of all models on a particular dataset and the last row (mean) denotes the average performance of a particular model across all datasets. Numbers indicate the average of Harrell’s concordance index across five cross-validation folds.
