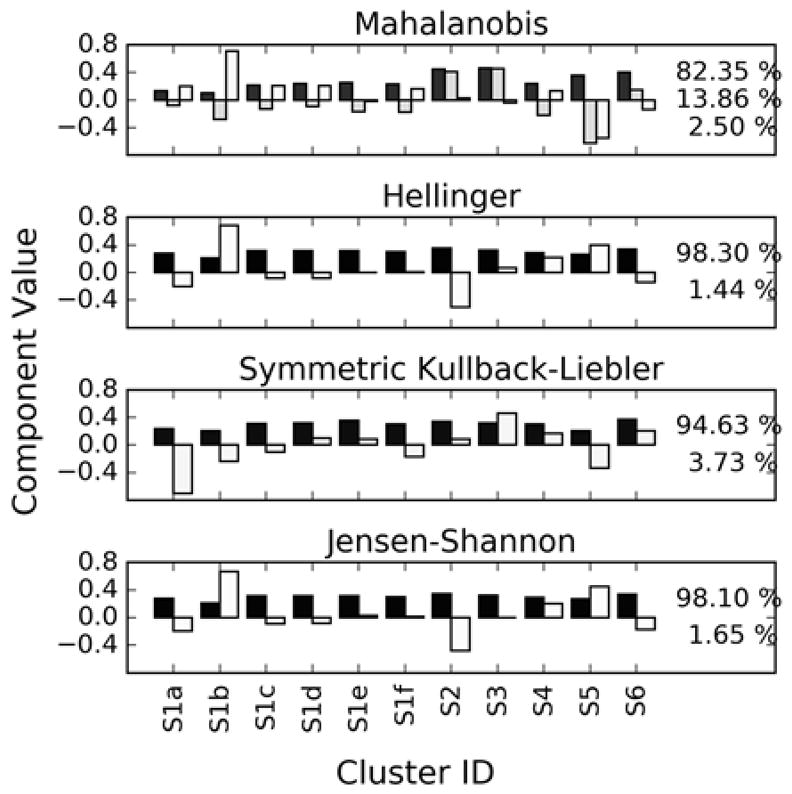
Figure 4.

PCA loadings (P) shaded by explained variance fractions for the Z matrices (Zi,k values). Black represents more explained variance, so the black bar is the first principal component. Plots are annotated with the explained variance fractions for the first L principal components. Note that, because this PCA is conducted on the Zi,k values, each loading vector will appear as a laboratory performance vector similar to that in Fig. 3.
