Figure 5.

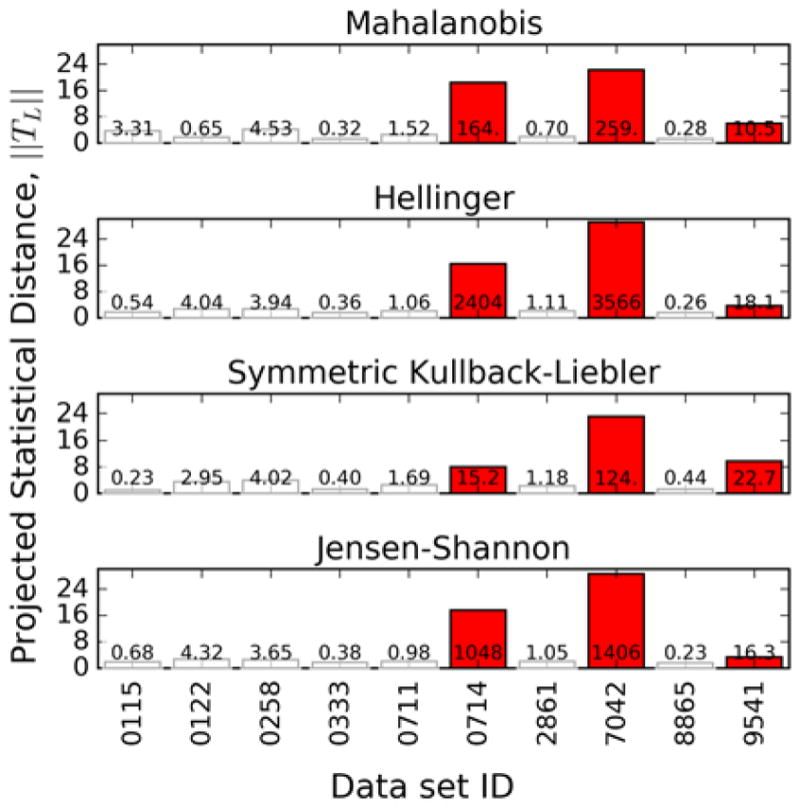
Projected statistical distance ||TL,i|| calculated using each metric. Bars are annotated with their corresponding Z̑i Outlier data sets are colored red.

Projected statistical distance ||TL,i|| calculated using each metric. Bars are annotated with their corresponding Z̑i Outlier data sets are colored red.