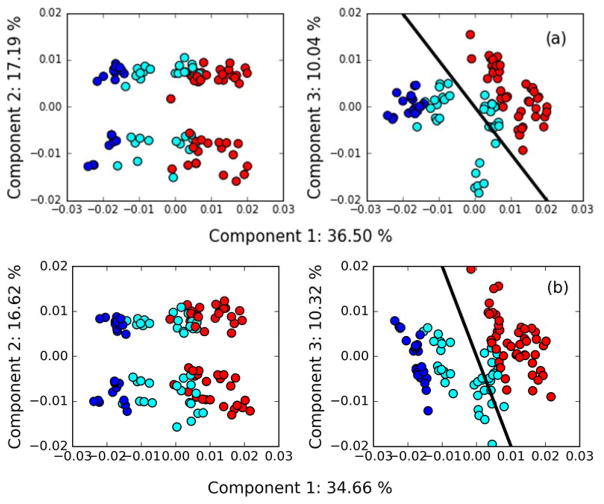
Figure 7.
PCA scores and explained variance fractions for the biologically-obtained NMR spectra, after removal of outlier data sets identified using the synthetic mixtures, along with the approximate direction of separation indicated by the thick black lines. Samples from the control site are colored cyan and those from the polluted site are colored red. The dark blue points are the three biological samples BC1a, BC1b, and BC1c. Outlier data sets are removed based on results from (a) the outlier detection methodology in this work (see Table 2) and (b) removing only the 800 MHz spectra.

