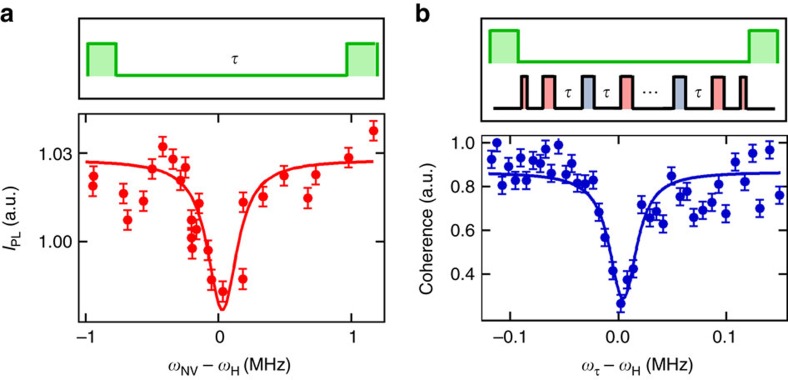
Figure 4. Comparison of microwave-free T1-NMR to the XY8 protocol.
(a,b) Spectra from Poly(methyl methacrylate) (PMMA) obtained with a single 14NV centre by using: (a) microwave-free T1 relaxometry after the GSLAC, with a probe time τ=100 μs; (b) an XY8-N dynamical decoupling sequence with N=256 microwave pulses at a field B=300 G. The corresponding pulse sequence is depicted with laser pulses in green and microwave pulses in red or blue corresponding to 0° or 90° relative phase. In a, the spectrum is constructed by varying the NV frequency, ωNV, via varying the magnetic field strength. In b, it is constructed by scanning the probe frequency ωτ=π/τ, where τ is the inter-pulse delay, inclusive of the finite π pulse duration. Error bars represent the photon shot noise (one s.d.). Horizontal error bars are not shown as they are smaller than the data points. By fitting the data to the theoretical decay caused by a semi-infinite layer of hydrogen spins we can estimate the distance, d, of the NV centre below the surface (Supplementary Note 3). This gives d=10.7±0.1 nm for the data in a and d=10.5±0.1 nm for the data in b.

