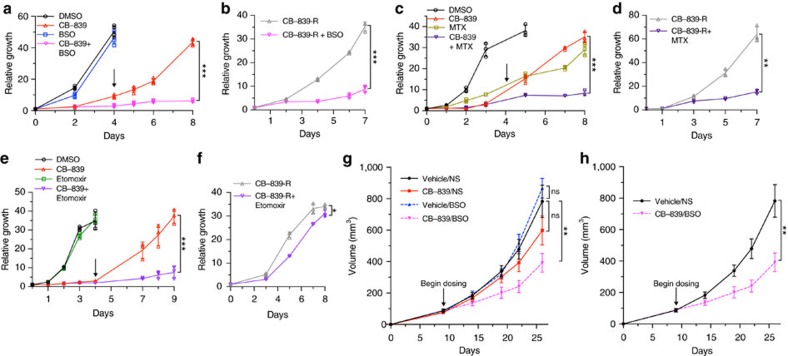
Figure 7. GLSi proteomics and metabolomics predicts responsiveness to oxidative stress targeted combination treatment.
(a) Relative proliferation of MPDAC-4 cell line treated with CB-839 or DMSO with or without BSO (100 μm). Data are plotted as mean relative cell proliferation, error bars depict±s.d. of four independent wells from a representative experiment (of three experiments). Arrow represents time point when treatments were refreshed, similarly in c,e. (b) Relative proliferation of CB-839-resistant (CB-839-R) MPDAC-4 cell line treated with CB-839 alone or in combination with BSO (100 μm). Data are plotted as mean relative cell proliferation, error bars depict±s.d. of three independent wells from a representative experiment (of three experiments). (c) Relative proliferation of MPDAC-4 cell line treated with CB-839 or DMSO with or without methotrexate (MTX) (50 nm). Data are plotted as mean relative cell proliferation, error bars depict±s.d. of three independent wells from a representative experiment (of three experiments). (d) Relative proliferation of CB-839-R MPDAC-4 cell line treated with CB-839 alone or in combination with methotrexate (50 nm). Data are plotted as mean relative cell proliferation, error bars depict±s.d. of three independent wells from a representative experiment (of three experiments). (e) Relative proliferation of MPDAC-4 cell line treated with CB-839 or DMSO with or without etomoxir (100 μm). Data are plotted as mean relative cell proliferation, error bars depict±s.d. of three independent wells from a representative experiment (of three experiments). (f) Relative proliferation of CB-839-R MPDAC-4 cell line treated with CB-839 alone or in combination with etomoxir (100 μm). Data are plotted as mean relative cell proliferation, error bars depict±s.d. of three independent wells from a representative experiment (of three experiments). (g) MPDAC-4 cells were implanted subcutaneously in nude mice and after the average tumour size of the cohort reached ∼50 mm3 mice were randomized and treated as indicated with vehicle, CB-839, BSO, or CB-839 and BSO, (n=8 per arm), see methods for full details of dosing. Tumours were measured twice a week. Error bars represent±s.e.m. (h) Data as in (g) reproduced without CB-839 and BSO arms. Error bars represent±s.e.m. Significance determined by t-test in all panels. *P<0.05, **P<0.01, ***P<0.001, ns: non-significant, P>0.05.

