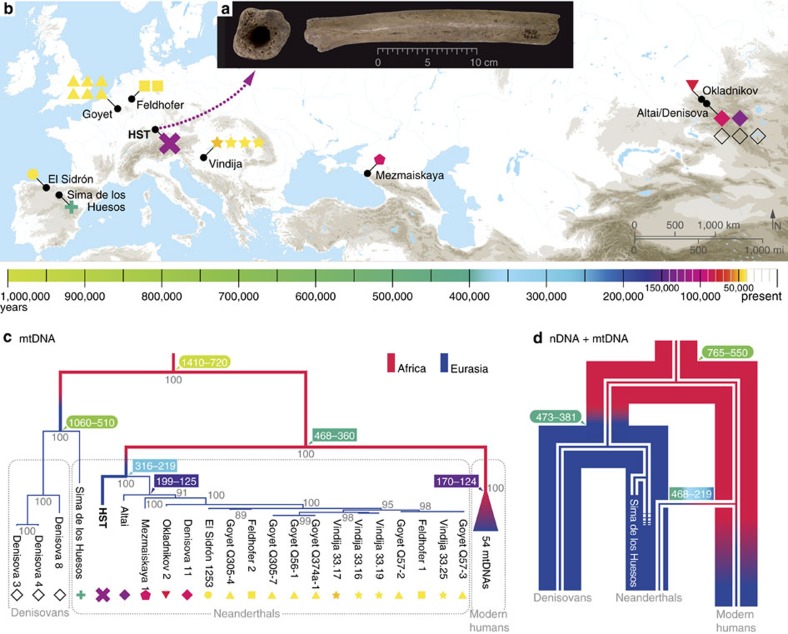
Figure 1. Archaic and modern humans' mtDNA and nDNA evolutionary scenarios.
(a) Pictures of the HST femur, (b) map of archaeological sites where complete mtDNA from archaic humans were reconstructed, (c) maximum parsimony tree of 54 modern human (collapsed), 18 Neanderthal, 3 Denisovan and 1 Sima de los Huesos mtDNAs built with coding region only and 98% partial deletion. Grey node numbers refer to bootstrap support after 1,000 iterations. Tree rooted with a chimpanzee mtDNA (not shown). (d) Schematic comparison of the nDNA (wide lines) with the mtDNA (thin lines) phylogenies of Neanderthals, Denisovans and modern humans. In c,d, colour legend for individual symbols and node numbers is illustrated in the horizontal time line. Node numbers in rectangular boxes are divergence times estimated in this study (Table 1), while in oval boxes are dates estimated in Prüfer et al.5 and Meyer et al.3 in thousand years before present. Red and blue tree branches represent supposed African and Eurasian distribution, respectively.

