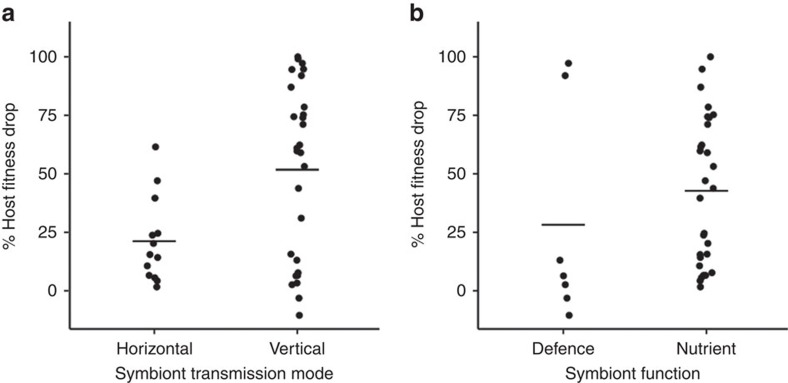
Figure 3. Transmission mode and symbiont function correlate with host dependence.
Each data point represents the mean % reduction in host fitness when its symbiont is removed from each unique symbiosis. The horizontal lines represent the mean % host fitness reduction. (a) Hosts tend to be more dependent on vertically transmitted symbionts. Plotted Nsymbioses=38; (b) Hosts tend to be more dependent on nutritional compared to defensive symbionts. Plotted nutritional, Nsymbioses=28, and defensive, Nsymbioses=7.

