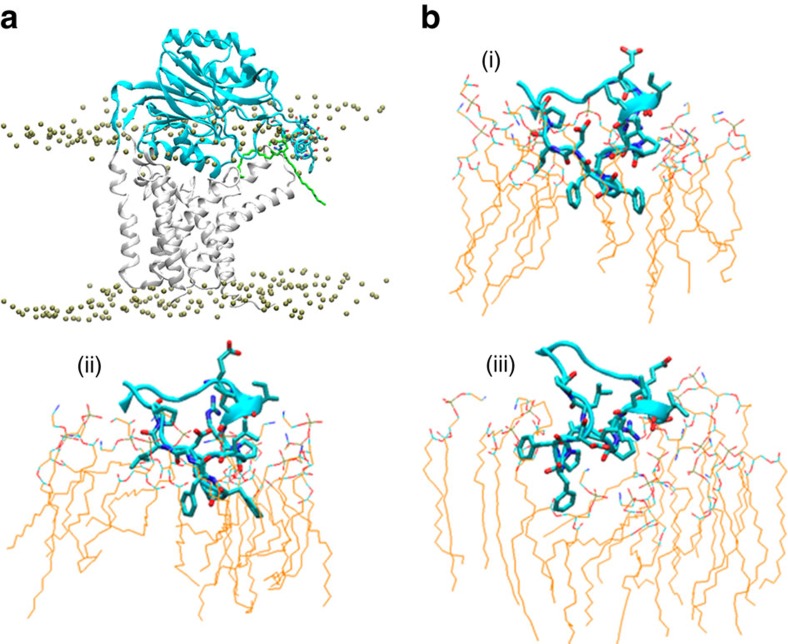
Figure 5. Snapshot of the last step of simulation 1.
In this simulation (Sim 1), the lid loop is embedded into the lipid membrane. (a) Overall conformations of Lnt and surrounding lipid molecules. The Nit and TM domains are shown as cyan and grey cartoon model, respectively, and the lid loop region is shown in cyan stick model. For the lipid bilayer, only the phospho-atoms from the lipid molecules are shown as spheres, except for one lipid molecule inside the cavity, which is shown as green stick model. (b) More detailed interactions between lid loop residues (thick stick models) and surrounding lipid molecules (thin line models) for three snapshots. (i) The initial energy-minimized model; (ii) a snapshot after 20 ns simulations with Lnt constrained; (iii) a snapshot after 150-ns free dynamics simulations. (Also see a Supplementary Movie 1).

