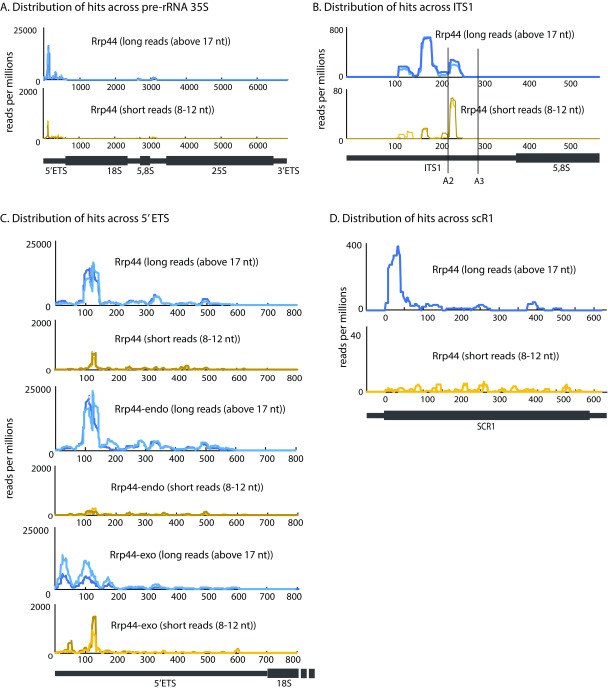
Figure 3. Distributions of long and short reads across pre-rRNA and scR1.
( A– C) Distributions of long and short reads across the pre-rRNA. ( A) Full length 35S pre-rRNA reads recovered with Rrp44. ( B) Internal transcribed spacer 1 (ITS1) and 5.8S rRNA reads recovered with Rrp44. ( C) 5’ external transcribed spacer (5’ ETS) reads recovered with Rrp44, Rrp44-exo or Rrp44-endo. ( D) Distribution of long and short reads recovered with Rrp44, across scR1. Data were normalized by millions of reads. Two biological replicates are shown in each graph. Scale is linear.

