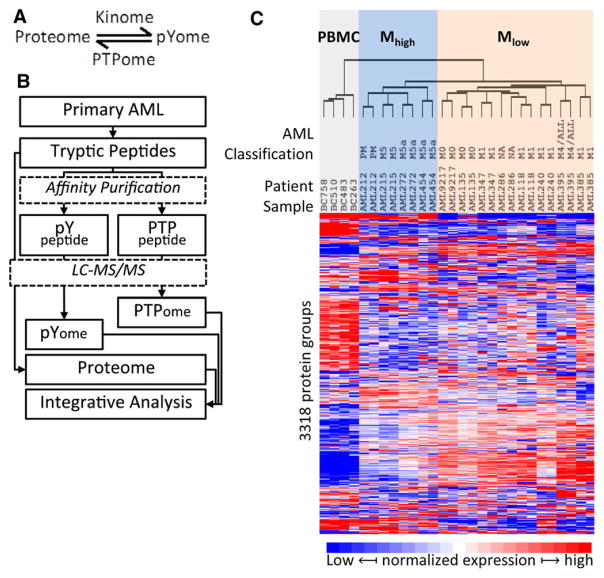
Figure 1.
Profile of total protein in AML. (A) The dynamic regulation of protein tyrosine phosphorylation by kinases (kinome) and phosphotyrosine phosphatase (PTPome). (B) The experimental design and proteome analysis of AML tumors. AML cells were treated as illustrated and three MS datasets were obtained from LC-MS/MS analysis: Proteome, pYome and PTPome. (C) AML proteome analysis. Unsupervised clustering of AML and PBMC cells according to the normalized variation of abundance of 3318 proteins. The French–American–British morphology classification (FAB classification; M0 through M5), when known, is indicated. The samples cluster into three main groups including the control PBMC samples (shaded gray); a group designed Mhigh (shaded blue) comprising AML samples related to M5 classification cases; and a third group, designated Mlow, mainly comprising AML cases with minimal (M1) or no (M0) maturation. Averages of protein expression in two experiments were used for statistical analysis.

