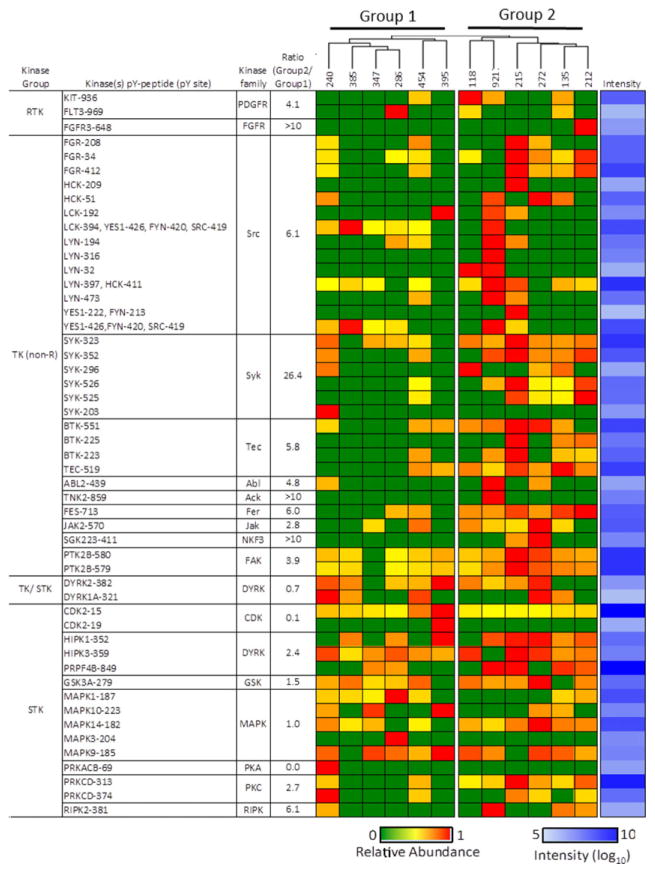
Figure 3.
Protein kinase phosphorylation in AML. Heat map showing the relative abundance of pY peptides for the indicated protein kinases that were detected in AML. Phosphopeptides were quantified according to integrated extracted ion currents with MaxQuant software and normalized to sample starting material. The blue column on the far right represents log10 maximum intensities for each phosphorpeptide across all AML samples. The ratio of signals from Group 2 and Group 1 samples (fourth column) was calculated as the ratio of mean average of quotients of summed signals from Group 2 peptides versus summed signals from Group 1 peptides (Supporting Information Table 5). In cases of zero divisors, a value of 10 was used. In cases of only a single peptide with a zero divisor, the ratio was set to >10.

