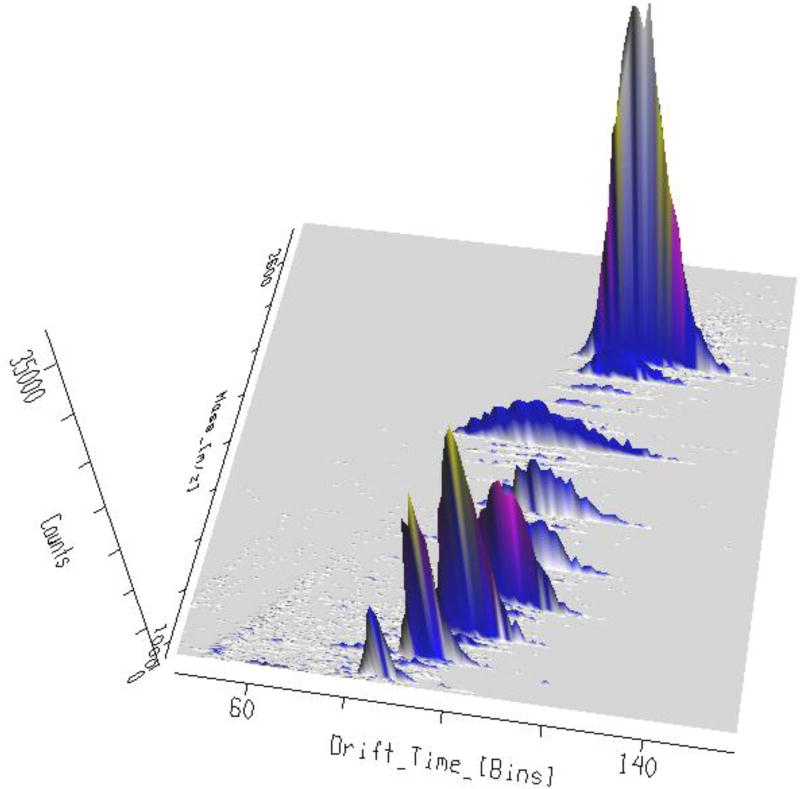
Figure 4. Drift time values for various ESI charge states of an oligonucleotide sprayed from a NFTB/OA solution.
Drift times for −5 to −12 charge states of the 33-mer phosphorothioate are shown here. It is clear that while the higher charge states at low m/z region (particularly the first four peaks) have fallen on a straight line indicative of the same drift time series, lower charge states have shifted to another series with shorter drift times (the last 2 peaks fall on a second line different from the line passing through higher charge states).

