Fig. 8.

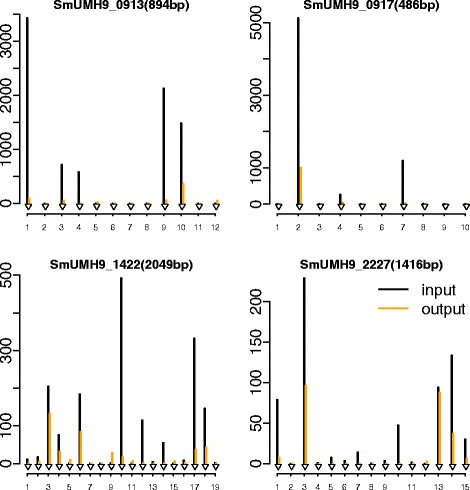
Distribution of insertion counts in four genes. The x-axis is the location and each insertion site is indicated by a black arrowhead. The y-axis is the averaged normalized read counts for input (black) and output (orange) samples

Distribution of insertion counts in four genes. The x-axis is the location and each insertion site is indicated by a black arrowhead. The y-axis is the averaged normalized read counts for input (black) and output (orange) samples