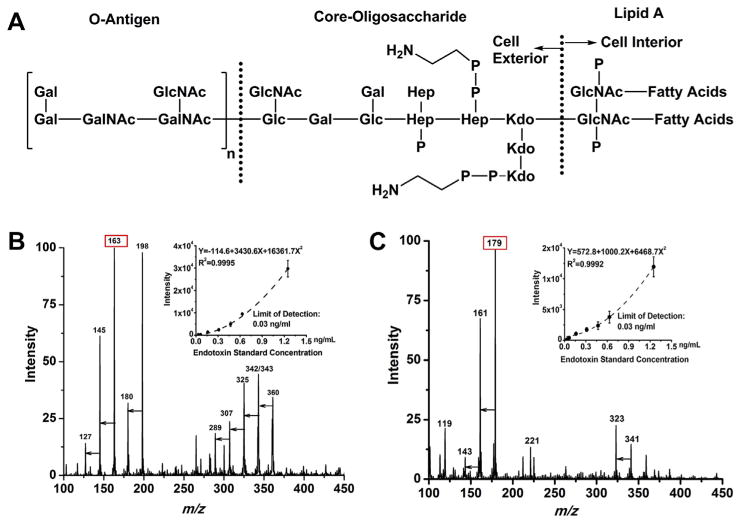
Fig. 1.
The scheme of chemical structure of endotoxin is shown in 1A (Gal: galactose, Glc: glucose, GalNAc: N-acetyl-galactosamine, GlcNAc: N-acetyl-glucosamine, Hep: L-glycerol-D-manno-heptose, KDO: 2-keto-3-deoxyoctonic acid). 1B and 1C show mass spectra of 0.62 ng mL−1 endotoxin in positive mode and negative mode respectively, where major peaks on the spectra were annotated with m/z values and the unlabeled arrows indicate consecutive water losses. Corresponding calibration curves are listed on the upper right hand corner of each spectrum. Lower limit of detection was established at 0.03 ng mL−1 or equivalent to 0.3 EU mL−1 endotoxin using the intensity of m/z 163 in positive mode and intensity of m/z 179 in negative mode. Triplicate measurements were averaged for each data point on the curve.

