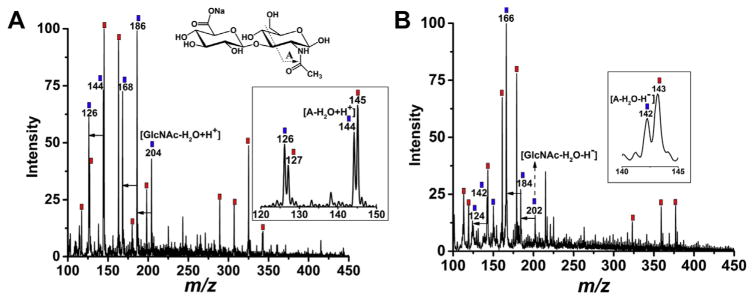
Fig. 2.
Mass spectra for the mixture of endotoxin and sodium hyaluronate (NaHA) in positive (2A) and negative (2B) modes, respectively. The displayed sample contains 10 ng mL−1 endotoxin and 1 to 10 wt ratio of NaHA in 50:50 methanol: water mixture. Red square labeled m/z ions indicate endotoxin signal, NaHA generated characteristic peaks in the same region are labeled as blue squares, where the proposed structures are annotated using its repeating disaccharide unit. Inserted windows show zoomed mass regions to display the detailed mass signal difference for endotoxin and NaHA. Unlabeled arrows indicate water loss for NaHA. (For interpretation of the references to colour in this figure legend, the reader is referred to the web version of this article.)

