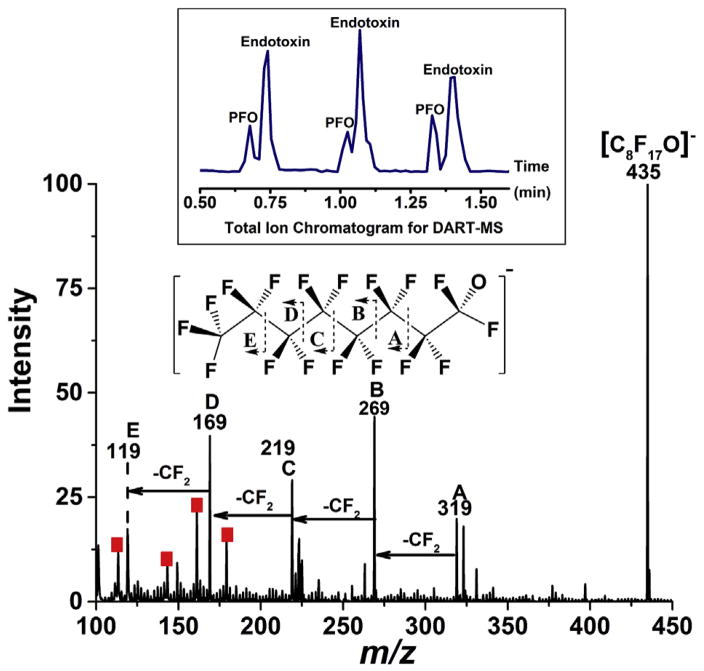
Fig. 3.
Mass spectrum acquired for the mixture of endotoxin and perfluoro-n-octane (PFO) in negative ion mode. 1 μL PFO was pipetted on top of 1 μL of 1.25 ng mL−1 of aqueous endotoxin on a DIP-it tip, and the mixture was analyzed by DART-MS immediately through manual sampling. PFO fragmentation pattern was obtained by applying 30 V in-source fragmentation; red squares indicate the major endotoxin signals at 400 °C DART analysis. During the DART ionization, one of the fluorine’s of PFO is replaced by an oxygen atom to produce the most intense peak on the spectrum (C8H17O−). (For interpretation of the references to colour in this figure legend, the reader is referred to the web version of this article.)

