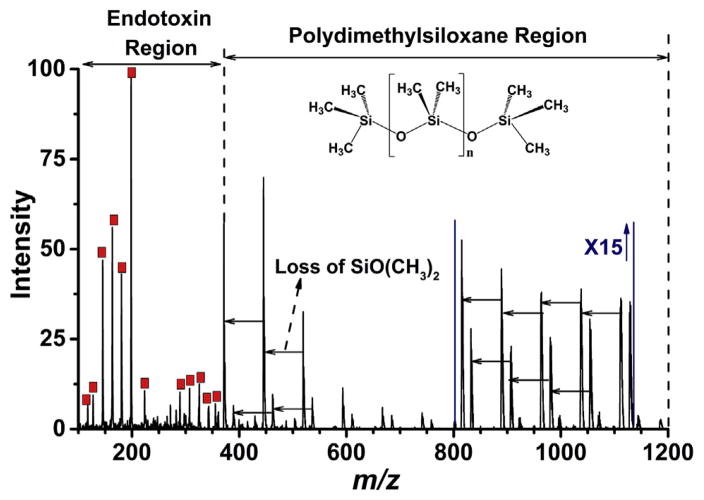
Fig. 4.
Mass spectrum for a mixture of endotoxin and polydimethylsiloxane standard in positive ion mode. 1 μL of 1.25 ng mL−1 of aqueous endotoxin and 1 μL of 1–100 dilution of silicone oil in hexane were spotted on top of each other to the bottom of DIP-it tip. Liquid sample was air dried before the DART-MS analysis at 400 °C. Two different mass distributions were observed for endotoxin (red square highlighted) and polydimethylsiloxane. Y axis intensity scale is zoomed for 15 fold between m/z 800 to m/z 1150; loss of SiO (CH3)2 was a common fragmentation observed for polydimethylsiloxane (indicated by horizontal arrows on the spectrum). (For interpretation of the references to colour in this figure legend, the reader is referred to the web version of this article.)

