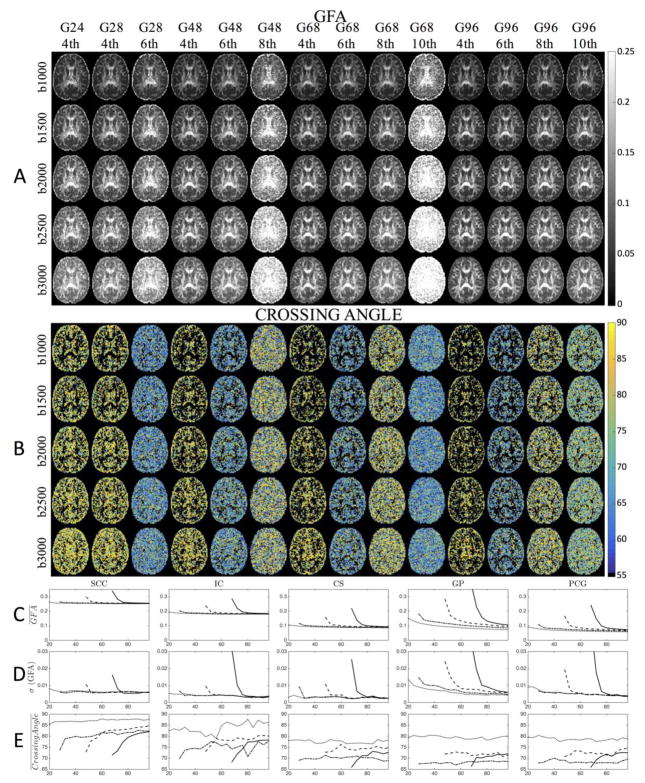
Figure 3.
The effect of the number of gradient directions, and maximum SH order on the GFA and Crossing Angle are shown in representative axial slices (A and B) and ROI-based analysis (C–E) for a b-value of 2,000 s/mm2. Maximum SH order fit is indicated by line style (dotted line=4th order; dash-dot=6th order; dashed=8th order; solid=10th order). Note, in the Crossing Angle figures (B), voxels with only one resolved fiber population are shown as black. For results at all b-values, see Supplementary Figure 1.

