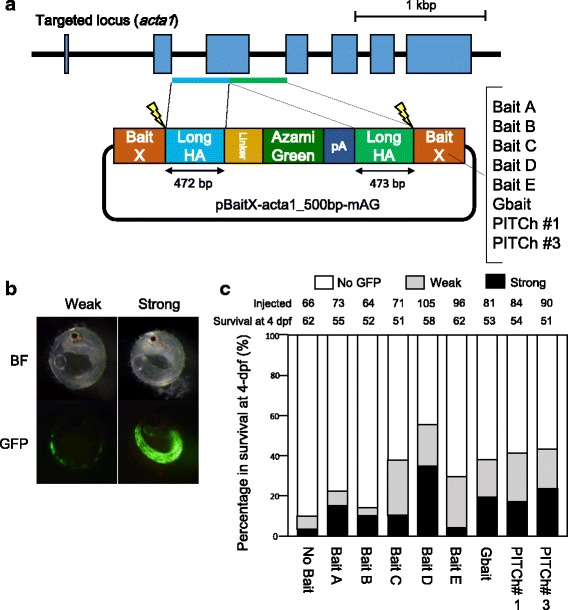
Fig. 2.

Comparison of the efficiencies of targeted gene integration among bait sequences. (a) Schematic illustration of the genomic targeted locus, acta1, and donor plasmids containing each bait sequence. Long homology arms (Long HAs) are shown in boxes with light blue or green. (b) Representative GFP expression in injected embryos at four days post fertilization (dpf). The injected embryos are categorized by GFP expressing area into the following three groups; “No GFP”, “Weak”, or “Strong” with no fluorescence, less than 40% fluorescence, or more than 40% fluorescence of the skeletal muscle, respectively. (c) Evaluation of the efficiencies of targeted gene integration of donor vectors with various bait sequences. The number of injected eggs is shown as “Injected”, and the number of survived embryos at 4-days post fertilization (dpf) among the injected eggs is shown as “Survival at 4 dpf”
