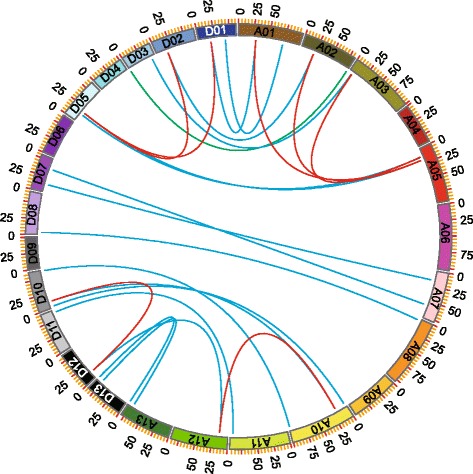
Fig. 3.

Collinearity analyses within G. hirsutum. The ends of blue lines link two genes from the homologous chromosome pairs in At and Dt sub-genomes, respectively, showing the orthologous pairs that diverged from a same ancestor. The green line links two duplicated genes locating in non-homologous chromosome pair in At and Dt sub-genomes. The ends of the red lines link the homologous pairs formed by segmental duplication within the At- and Dt-subgenomes. A01 to A13 represent the chromosomes in At sub-genome and D01 to D13 represent the chromosomes in Dt sub-genome.
