
Fig. 2.
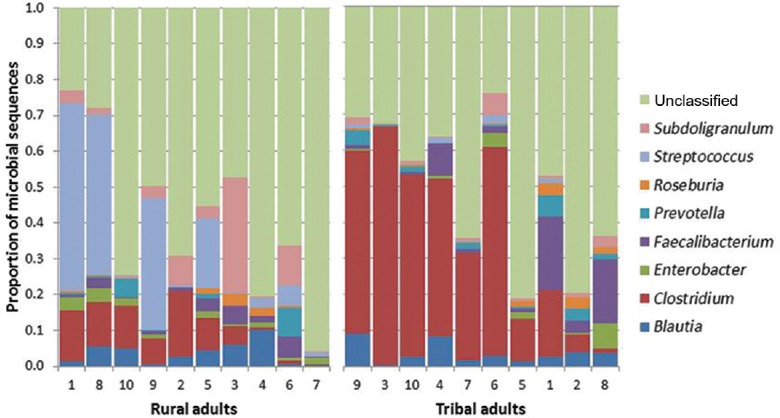
Frequency of microbial sequences at the genus level. A comparison of tribal adult and rural adult groups. The stacked bars (each representing one individual participant) show the proportion contributed by each genus.
Official websites use .gov
A
.gov website belongs to an official
government organization in the United States.
Secure .gov websites use HTTPS
A lock (
) or https:// means you've safely
connected to the .gov website. Share sensitive
information only on official, secure websites.
Frequency of microbial sequences at the genus level. A comparison of tribal adult and rural adult groups. The stacked bars (each representing one individual participant) show the proportion contributed by each genus.