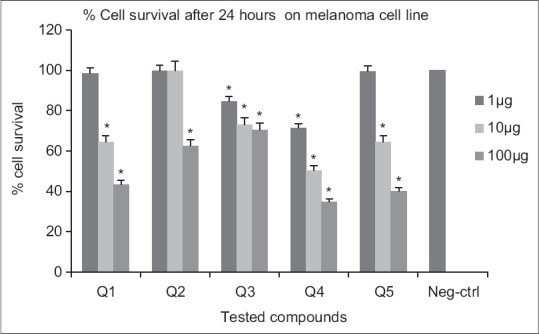
Figure 4.

Cytotoxic effects of compounds on melanoma cell line following exposure to different concentrations of compounds (after 24 h). Data are presented as mean ± standard deviation, *P < 0.05, n = 3, Neg-ctrl: Negative control

Cytotoxic effects of compounds on melanoma cell line following exposure to different concentrations of compounds (after 24 h). Data are presented as mean ± standard deviation, *P < 0.05, n = 3, Neg-ctrl: Negative control