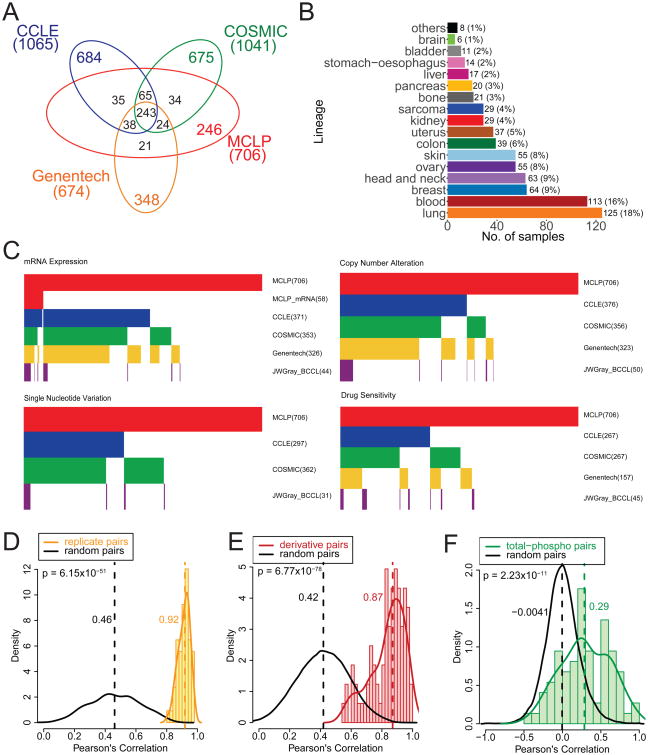
Figure 1. Overview of the MCLP cell line dataset and associated molecular and drug data.
(A) Venn diagram of the MCLP cell line set with other large public cell line resources, including CCLE, COSMIC Cell Lines Project, and Genentech Cell Lines Project. (B) Distribution of MCLP cell lines in various lineages. (C) Heatmaps summarizing the publically available mRNA expression, copy number alteration, single nucleotide variation and drug sensitivity data. In the heatmaps, each vertical line in the top row represents a cell line in the MCLP set, and each line in other rows indicates the corresponding molecular data is available for that specific data type. The CTRPv2 drug sensitivity data were based on CCLE cell lines, and the GDSC data were based on COSMIC cell lines. (D) RPPA data reproducibility based on replicate samples of NCI60 cell lines. Random pairs were sampled from NCI60 cell lines only. (E) Correlations of derivative cell lines relative to random cell line pairs that were sampled from all cell lines surveyed. (F) Correlations of total- phosphorylated protein pairs relative to random protein pairs. Vertical dotted lines indicate the median values. See also Table S1 and Figure S1.

