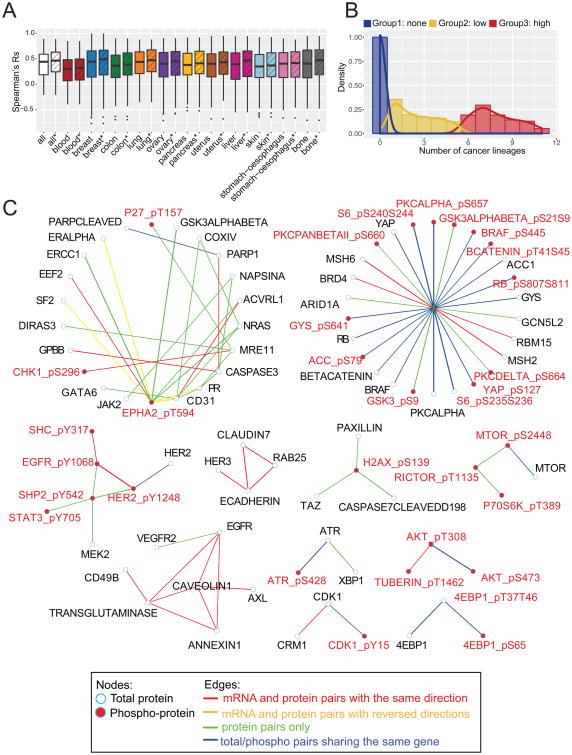
Figure 2. Comparison of protein and mRNA expression in MCLP cell lines.
(A) Box plots of the expression correlations of matched mRNA and protein pairs in different lineages. Box boundaries mark the first and third quartiles, with the median in the center, and whiskers extending to 1.5 interquartile range from the boundaries. The striped box plots were based on the protein sets after excluding the 20% of proteins with the lowest coefficient of variation within each lineage. (B) Distribution of the number of lineages in which the mRNA and protein pair show a significant correlation. Three protein groups are shown in different colors. (C) Co-expression network of protein–protein expression. See also Tables S2-4 and Figure S2.

