
Fig. 4.
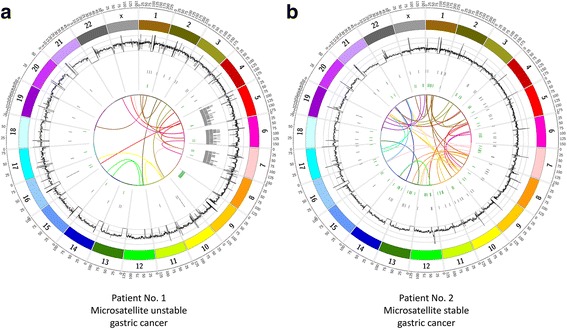
Circos plots of all somatic, quality filtered large structural variants of the MSI (a) and MSS (b) tumor samples, of patient 1 and 2, respectively. In order from outer to inner rings: genomic position, coverage (black), deletions (grey), inversions (green), and translocations (center). The coverage histogram was based on a sliding window, with window size 150,000 and step size 75,000. The maximum axis limit of the coverage histogram was set to 100