
Fig. 1.
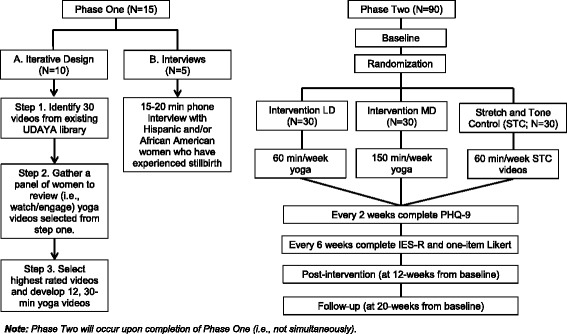
Study flow chart: the left side of the diagram illustrates the flow of the study for phase 1, and the right side illustrates the phase 2
Official websites use .gov
A
.gov website belongs to an official
government organization in the United States.
Secure .gov websites use HTTPS
A lock (
) or https:// means you've safely
connected to the .gov website. Share sensitive
information only on official, secure websites.
Study flow chart: the left side of the diagram illustrates the flow of the study for phase 1, and the right side illustrates the phase 2