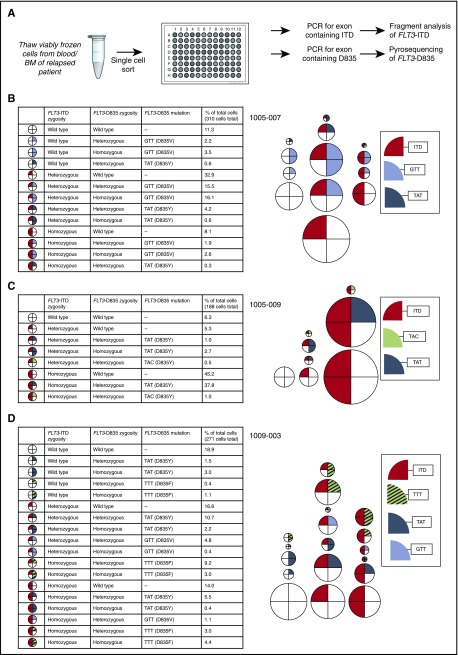
Figure 2.
Genetic heterogeneity revealed by single-cell sorting of samples from patients relapsed on quizartinib. (A) Schematic of experimental setup for single-cell sorting followed by FLT3 mutation genotyping. Percent of cells with indicated FLT3 genotype in patients (B) 1005-007, (C) 1005-009, and (D) 1009-003. Each circle represents a particular FLT3 genotype. The relative size of circles is representative of the relative proportion of the overall population with that genotype.

