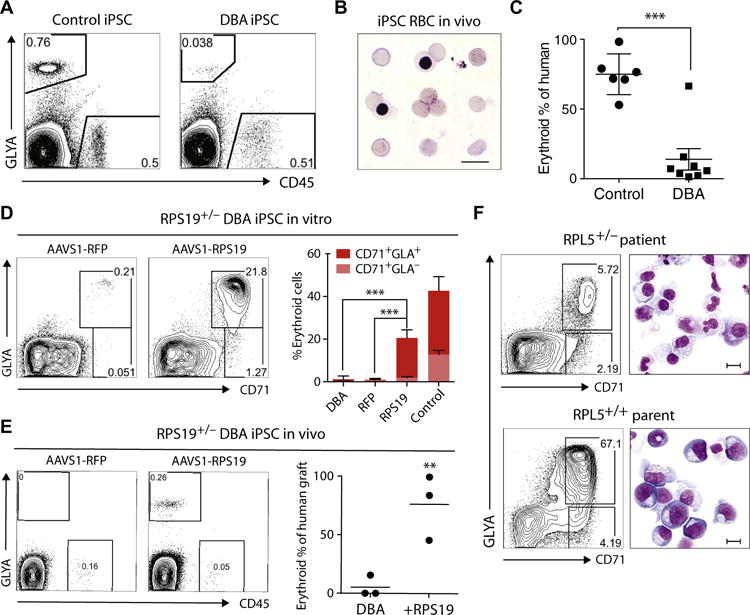
Fig. 2. DBA iPSCs show defective erythropoiesis in vivo and are rescued by gene complementation.

(A) Representative flow cytometry plots of human erythroid (GlyA+) and myeloid (CD45+) engraftment in the bone marrow (BM) of NSG mice transplanted with normal control (n = 6 mice) or DBA (n = 9 mice) CD34-5F cells. Engraftment was analyzed 4 weeks after transplantation using human-specific antibodies. (B) Giemsa stain of sorted GlyA+ RBCs from the BM of mice engrafted with normal control iPSC progenitors. (C) Erythroid cells as proportion of total human engraftment for normal control and DBA iPSCs, plotted as a percentage. Data are shown as means ± SD of two independent experiments with two normal control lines and two RPS19+/− DBA lines. Detailed engraftment data for each mouse are listed in table S2. (D to F) Gene complementation of DBA iPSCs. (D) Erythroid differentiation of RFP- and RPS19-complemented RPS19+/− DBA iPSCs in vitro. Erythroid cells were analyzed on day 9 using flow cytometry for markers CD71 and GlyA. Quantitation on the right is shown as means ± SD for three DBA iPSC, three RFP-corrected (RFP), and four RPS19-corrected (RPS19) iPSC lines independently derived during gene correction. (E) Flow cytometry showing erythroid engraftment of RFP- and RPS19-complemented RPS19+/− DBA iPSCs 4 weeks after transplantation in NSG mice (n = 3 each). Quantitation on the right shows human GlyA+ erythroid cells as a percentage of total human engraftment. (F) Flow cytometry and May-Grunwald-Giemsa staining showing erythroid differentiation of CD34-5F cells derived from the RPL5+/− patient and unaffected parent RPL5+/+ iPSCs. Erythroid cells were analyzed on day 9 using CD71 and GlyA expression. Scale bars, 10 μm. For all panels, **P < 0.01, ***P < 0.001, by unpaired t test.
