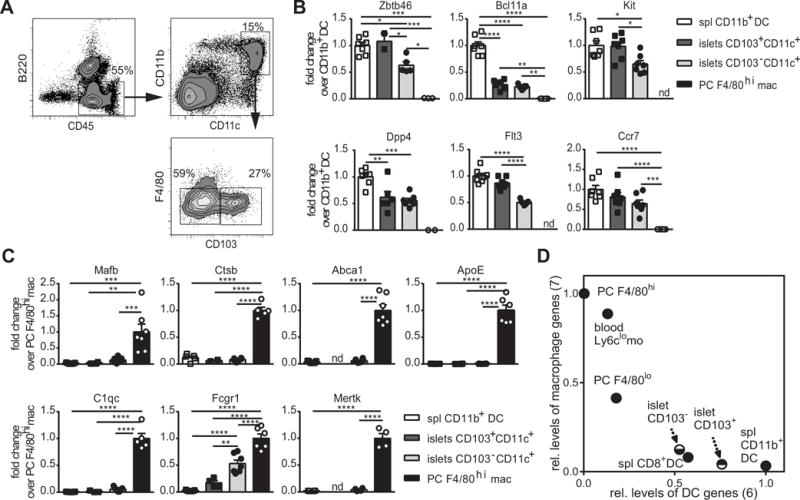
Figure 1. Transcriptional profile of CD11c+ cells in inflamed islets.

Representative plots of flow cytometric analysis of islets CD11c+ cells in 9-week-old pre-diabetic NOD.CD28−/− mice. (B and C) Fold change in cDC genes (B) and macrophage genes (C) in islet CD103+ and CD103− CD11c+ cells over the reference populations of splenic CD11b+ DC (DAPI− CD45+ B220− F4/80low CD11b+ CD11c+) and peritoneal F4/80hi macrophages (DAPI− CD115+ B220− MHCIIint F4/80hi). Each symbol represents one mouse and bars represent mean + SEM. Data are a summary of two independent experiments with at least 3 animals per experiment. One way ANOVA test with Bonferroni’s post hoc test were used to determine statistical significance (* p<0.05, ** p<0.01, *** p<0.001, **** p<0.0001). (D) Index of all DC signature genes (x axis) and macrophage signature genes (y axis) as listed in B and C for islet CD103+ and CD103− CD11c+ cells in comparison to reference DC and macrophage populations (PC: peritoneal cavity, mo: monocytes, spl: spleen).
