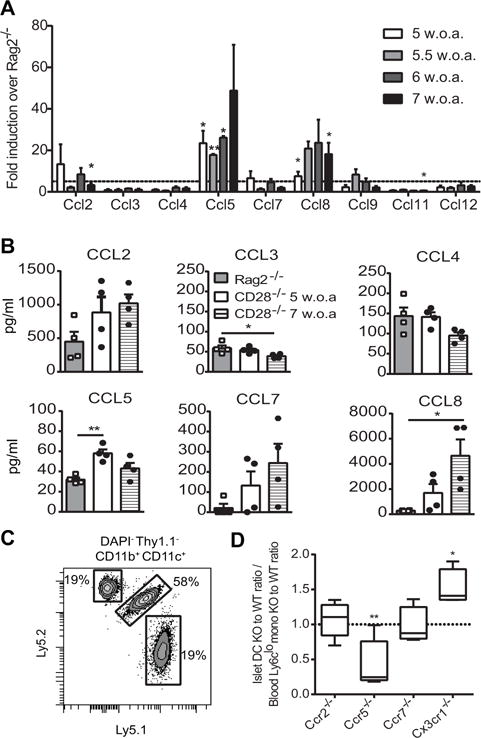
Figure 3. Role of chemokines in CD11c+ cell recruitment to inflamed islets.

(A) Expression of chemokine mRNA in NOD.CD28−/− islets was compared to that in NOD.Rag2−/− islets. Dashed line represents a 5-fold increase in NOD.CD28−/− islets over NOD.Rag2−/− islets. Bars depict mean fold-change + SEM from 3 independent experiments with 4–5 mice pooled per age group in each experiment (w.o.a., weeks of age). Statistical analysis for each time point was performed using one sample t test with hypothetical value of 1 for NOD.Rag2−/− group. (B) Chemokine protein concentrations in islet supernatants from NOD.Rag2−/− and NOD.CD28−/− mice are shown. Representative data from 3 independent experiments with each data point representing an individual mouse. Bars depict mean + SEM. Statistical analysis was performed using Oneway ANOVA. (C and D) Mixed bone marrow chimeras in NOD.Rag2−/−.Ly5.1/Ly5.2 recipient mice were prepared with 50:50 mix of bone marrow from Ly5.1 wild-type mice and Ly5.2 chemokine receptor knockout mice. (C) Representative flow plot pre-gated on DAPI−Thy1.1−CD11c+CD11b+ islet cells showing contribution of endogenous (Ly5.1+Ly5.2+) and donor bone marrow-derived cells on day 14 after transfer. (D) The ratio of knockout to wild-type CD11c+ cells was calculated using flow cytometry data and normalized to the ratio of knockout to wild-type donor monocytes in the blood. No difference in chimerism between blood and islets would be a value of 1 (dashed line). Boxes and whiskers depict the relative chimerism of 4–8 mice per group from 5 independent experiments. Statistical analysis was performed using one-sample t test comparing the ratio of knockout to wild-type CD11c+ cells in islets normalized to the ratio of knockout to wild-type blood monocyte precursors in the same mouse to the theoretical mean of 1 (*p < 0.05, **p < 0.01).
