Figure 1.

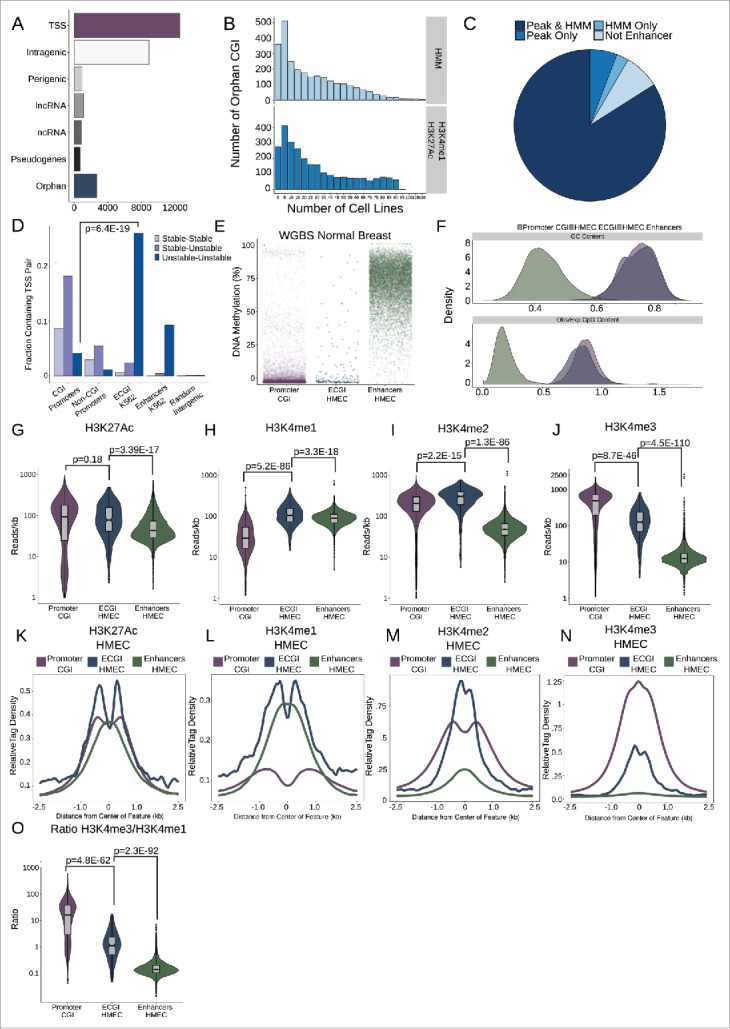
Most orphan CpG islands exhibit an enhancer chromatin state. (A) CpG Islands were categorized hierarchically by distance to the nearest Gencode annotated gene. Shown is the number of CGI that overlap the TSS of a protein-coding gene (TSS), those that overlap a protein coding gene but not the TSS (intragenic), those that lie in proximity (+/−2 kb) of a protein coding gene (perigenic), or those that are within 2 kb of, or overlap, a long non-coding RNA (lncRNA), other non-coding RNAs (ncRNA), or a pseudogene. CGI more than 2 kb from any of these gene classes were considered orphan CGI (see Methods). (B) Enhancers were defined either as the overlap of H3K4me1/H3K27Ac peaks or by an HMM chromatin state as annotated in over 100 cell lines (see Methods). The histograms represent the number of cell lines in which orphan CGIs overlap an enhancer by each definition. (C) Distribution of orphan CGI meeting one or both enhancer definitions in at least one cell line. (D) Stable or Unstable transcript pairs as defined in K562 cells15 were intersected with promoter CGI, the TSS (+/−500 bp) of other coding genes that not within 2.5 kb of a CGI, ECGI, and classical enhancers active in K562 cells. Shown is the fraction of each set of genomic regions that overlap stable, unstable or mixed transcript pairs. (E) Distribution of the average DNA methylation in WGBS data from normal breast tissue (TCGA) across promoter CGI (those overlapping a coding TSS), ECGI active in HMEC cells, and classical enhancers active in HMEC cells (those orphan CGI or other regions meeting both the H3K27Ac/H3K4me1 peak and HMM enhancer definition). (F) Density of the G+C content (%GC) and CpG content (Observed/Expected) among promoter CGI, vs. ECGI and classical enhancers active in HMEC cells. (G-N) Analysis of H3K27Ac or H3K4me1/2/3 at promoter CGI, HMEC ECGI, and HMEC classical enhancers. (G-J) Distribution of the density (reads/kb) for the indicated chromatin mark among genomic loci in each class. Line indicates median, boxes are the first and third quartiles and whiskers represent the highest and lowest values within 1.5 times the inter-quartile range. (K-N) relative tag densities for the indicated chromatin mark was determined in 10 bp bins for +/−2.5 kb from the center of each genomic feature class as determined from ChIP-seq data from HMEC cells (ENCODE). (O) Distribution of the ratio of H3K4me3 to H3K4me1 tag densities across genomic loci in each class.
