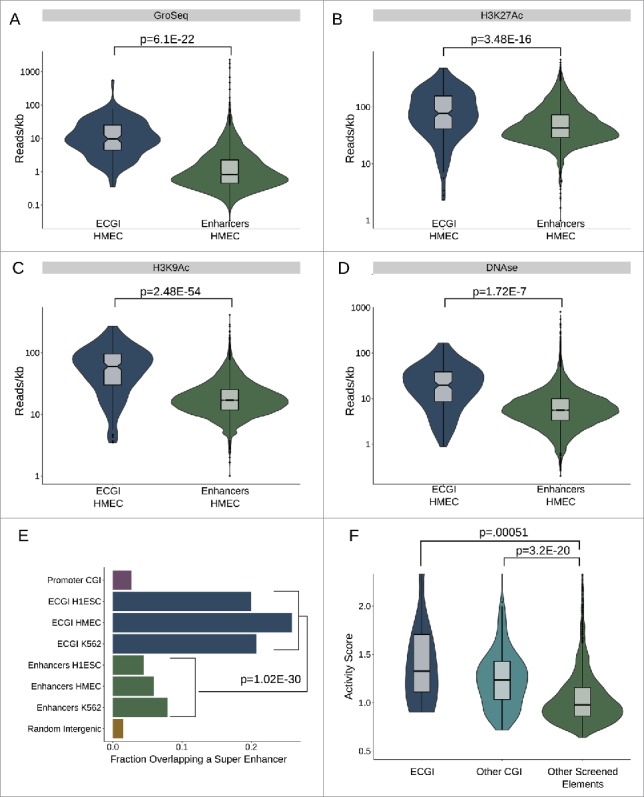
Figure 2.

ECGI are stronger than CpG-poor enhancers (A-D) Nascent transcription and chromatin features associated with open/ active chromatin at ECGI and classical enhancers. Shown is the distribution of tag densities (reads/kb) of nascent transcription (GroSeq, MCF7 cells), active chromatin features (H3K27Ac, H3K9Ac ChIP-seq), or open chromatin (DNase-seq; HMEC cells) across genomic loci in each enhancer class. (E) Promoter CGI, ECGI, and classical enhancers active in the indicated cell type were overlapped with genomic regions called as super enhancers as defined by the super enhancer archive (SEA). Shown is the fraction of genomic loci in each class overlapping any super enhancer in SEA. (F) Distribution of enhancer activity scores, defined by the ratio of GFP reporter mRNA to DNA copy number in lentiMPRA (see Methods).
