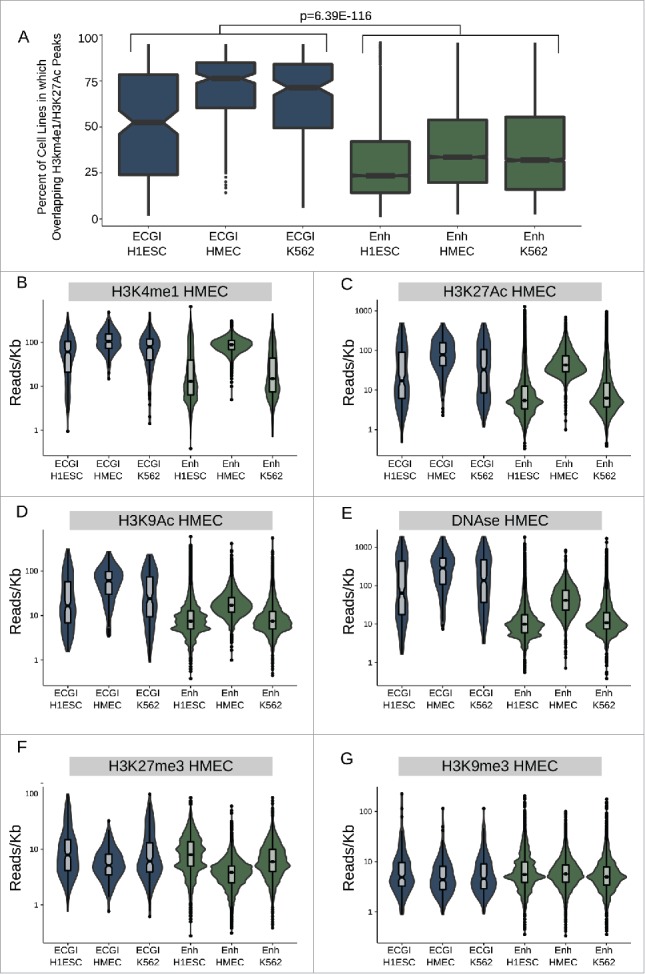
Figure 3.

ECGI are more widely active than CpG-poor enhancers A) Distribution of the percent of analyzed cell lines (n = 120) in which the loci in each class exhibit enhancer activity (overlap an annotated H3K4me1/H3K27Ac peak in that cell type). B-G) Distribution of the ChIP-seq or DNase-seq tag density (reads/kb) for the indicated chromatin feature as measured in HMEC cells (ENCODE) among ECGI or classical enhancers active in the indicated cell type.
