Figure 4.

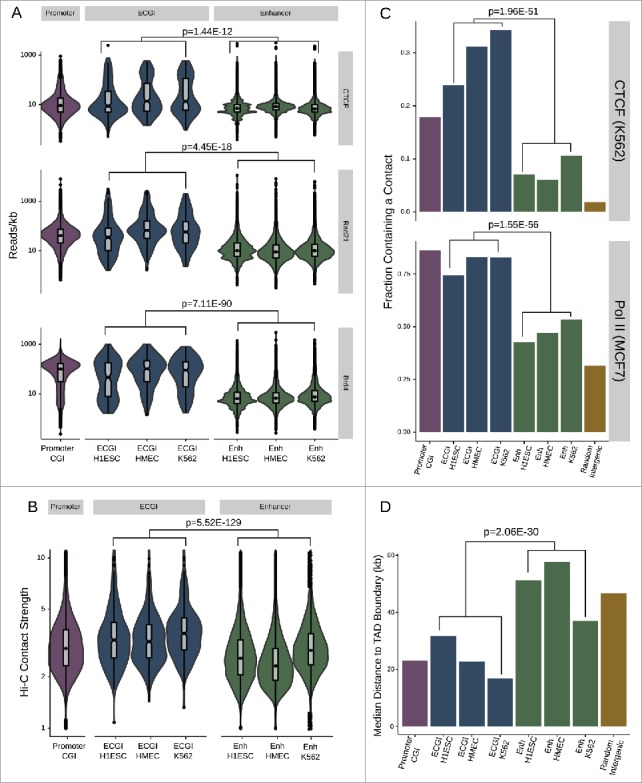
ECGI are hubs for genomic contacts (A) Distribution of the average CTCF (from H1ESC), cohesin/Rad21 (from MCF7 cells), or BRD4 (from MM.1S) ChIP-seq tag densities (reads/kb) among promoter CGI vs. ECGI or classical enhancers active in the indicated cell type. Genomic loci defined as in Fig. 1. (B) Annotated intrachromosomal contacts as defined by Rao et al.42 were extracted from K562 cell Hi-C data, overlapped with the genomic loci in each class, and the average strength of all contacts per locus was determined. Shown is the distribution of the mean intrachromosomal contact strength among promoter CGI vs. ECGI or classical enhancers active in the indicated cell type. (C) The fraction of loci in each genomic class that overlap an annotated contact as determined by ChIA-Pet of CTCF in K562 cells or of RNA polymerase (POLR2A) in MCF7 cells (ENCODE). (D) Median distance from TAD boundaries among genomic loci in each class as called in GM12878 cell Hi-C data.42
