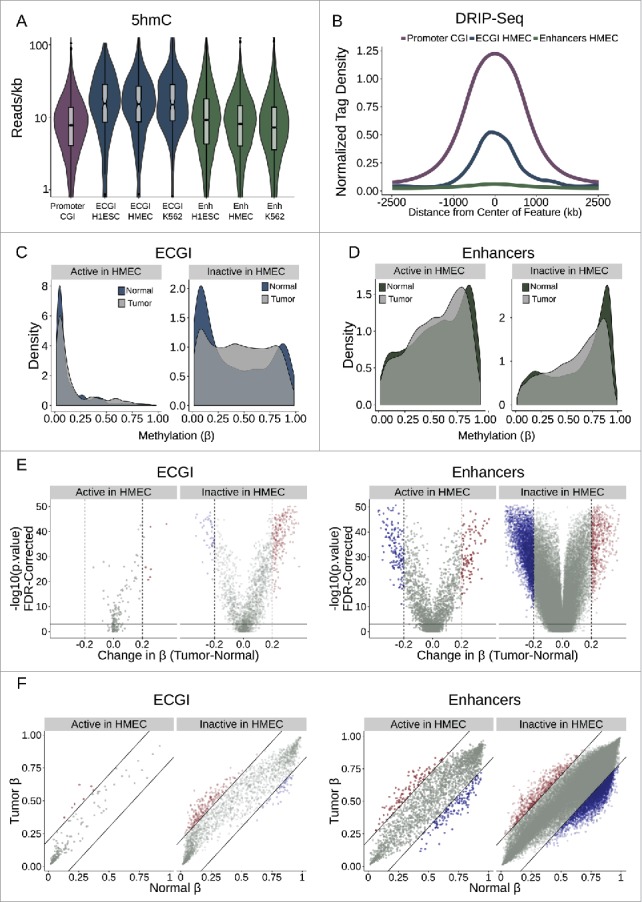
Figure 7.

Active ECGI are resilient to aberrant methylation in cancer (A) Distribution in tag density (reads/kb) of 5-hydroxymethylcytosine (5hmC) among promoter CGI vs. ECGI or classical enhancers active in the indicated cell type (5hmC Capture-seq data; IMR90 cells). (B) Mean normalized DRIP-seq (primary fibroblasts) tag densities in 10 bp bins for +/−2.5 kb from the center of promoter CGI vs. ECGI and classical enhancers active in HMEC. (C, D) Density of the average methylation level (β) per feature as determined by 450K Methylation Array in normal breast tissue (n = 97) or primary breast tumors (n = 781, TCGA). ECGI active in HMEC vs. inactive in HMEC are those CGI that overlap H3K27Ac/H3K4me1 peak and HMM enhancer definitions in HMEC vs. those called active in at least one other cell line assayed by the same criteria but absent from HMEC. Classical enhancers active vs. inactive in HMEC were similarly defined but do not overlap a CGI. (E) Volcano plot showing the change in the average DNA methylation (β value) per genomic feature among normal or breast tumor samples. Blue features are those ECGI/Enhancers significantly hypomethylated (FDR<0.01 and change in β < −0.2), and red features are those significantly hypermethylated (FDR<0.01 and change in β > 0.2). Active and inactive ECGI vs. classical enhancers are as defined in panels C and D. (F) Relationship between the average DNA methylation (β value) for each ECGI/ Enhancer between normal and breast tumor samples. Lines represent an average change in β of 0.2. Active and inactive ECGI vs. classical enhancers are as defined in panels C and D.
