
Figure 1.
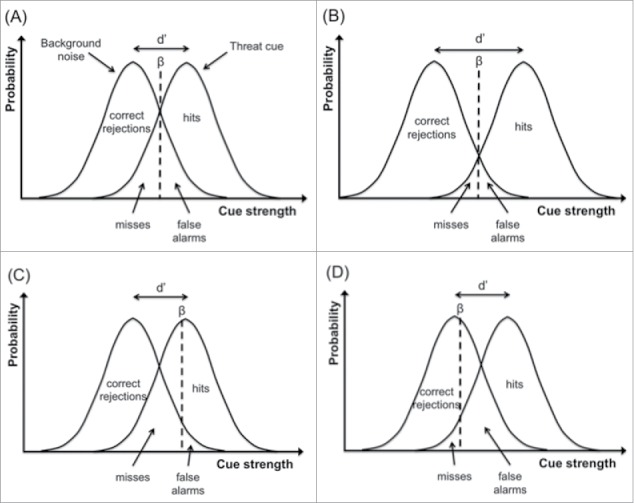
Signal detection theory applied to threat detection in animals. (A) The distributions of the threat cue and of background noise within the decision-maker overlap, and the difference in position between the 2 distributions reflects the sensitivity (d’) of the decision-maker to the threat cue; the decision-maker uses a criterion (i.e., threat detection threshold, β), to decide when a threat is present (i.e., when the internal signal is stronger than β); given this decision there are 4 possible outcomes: (i) the individual reports the threat present when it is (hit); (ii) the individual reports the threat present when it is absent (false alarm); (iii) the individual reports the threat absent when it is present (miss); and (iv) the individual reports the signal absent when it is absent (correct rejection); the probabilities for each of these outcomes are represented by the area under the curves. (B) Illustration of a hypothetical individual with higher threat sensitivity (d’; i.e., the difference between the proportion of hits and false alarms is higher); note that threat sensitivity (d’) and threat detection threshold (β) are independent measures of decision-making; in this example the sensitivity increased in comparison to (A), whereas the threshold remained the same. (C) Illustration of a hypothetical individual with a high threat threshold (β); it will reduce the number of false alarms at the cost of increasing the number of misses. (D) Illustration of a hypothetical individual with a low threat threshold; it will reduce the number of misses at the cost of increasing the number of false alarms.