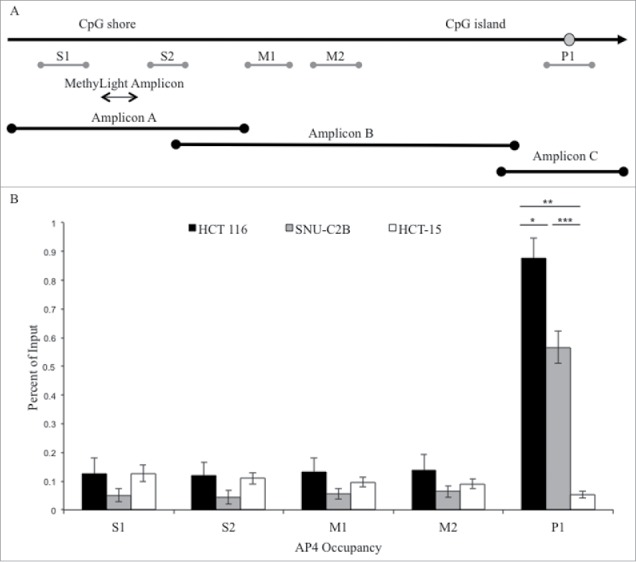
Figure 2.

ChIP analysis of AP4 occupancy at the MLH1 CpG island and shore region. (A) Chromatin immunoprecipitation followed by qPCR was performed at five regions upstream of MLH1, located in the CpG shore (S1 and S2), middle region (M1 and M2), and promoter CpG island (P1). MethyLight and bisulfite sequencing regions interrogated are also indicated. SNP location is indicated by gray circle. (B) Experiments were performed in HCT 116 (GG), SNU-C2B (GA), and HCT-15 (AA) cell lines to compare AP4 occupancy among genotypes of SNP rs1800734. Three biological replicates of each cell line were run in triplicate and averaged after ChIP-qPCR. Error bars represent standard deviation. *P < 0.05, **P < 0.01, ***P < 0.001 by independent samples t-test.
