Figure 2.

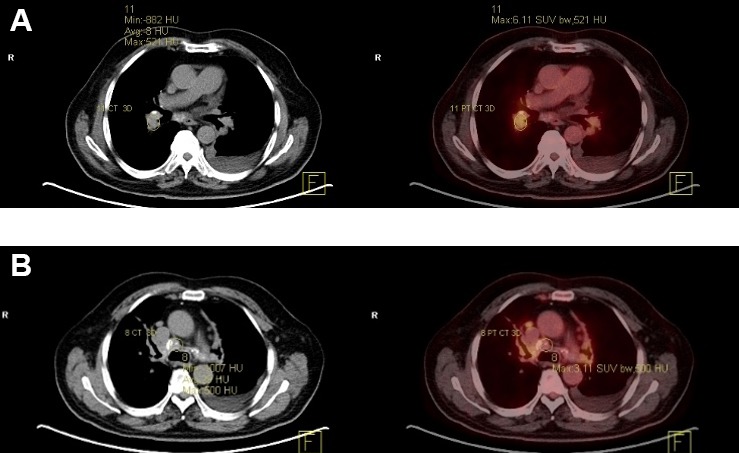
CT (left of images) showing calcified areas and PET (right of images) scans showing increased FDG-PET metabolic activity in the mediastinal mass (A) and perihilar lymph nodes (B). FDG-PET, fluorodeoxyglucose-positron emission tomography.

CT (left of images) showing calcified areas and PET (right of images) scans showing increased FDG-PET metabolic activity in the mediastinal mass (A) and perihilar lymph nodes (B). FDG-PET, fluorodeoxyglucose-positron emission tomography.