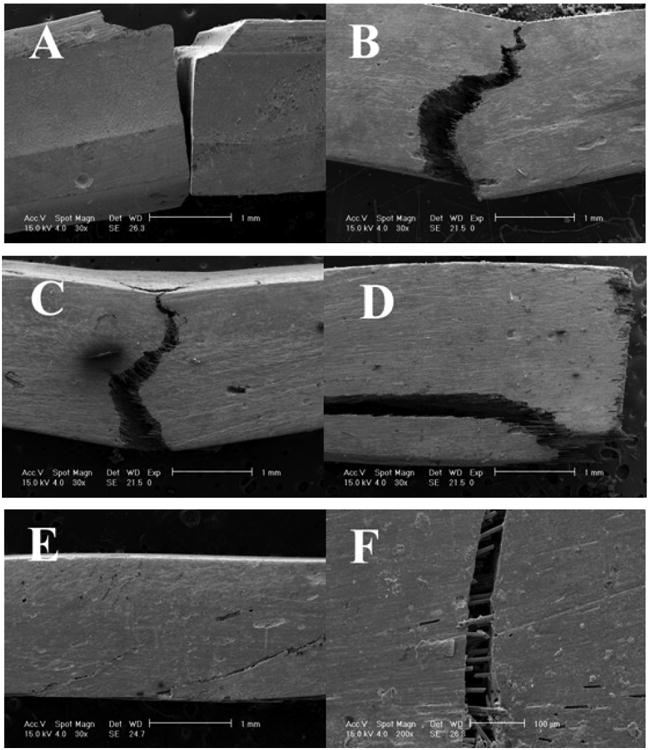
Figure 3.

SEMs Table 1 mechanical test fracture samples (A) PFC 3M Z100® always at complete fracture through test sample 30×. (B) PFC 3M Z100® with 30 wt% 0.5 mm fibers 30×. (C) PFC 3M Z100® with 30 wt% 1.0 mm fibers 30×. (D) PFC 3M Z100® with 30 wt% 2.0 mm fibers 30×. (E) PFC 3M Z100® with 30 wt% 3.0 mm fibers 30×. (F) FRC showing fibers internal to a crack with fiber fracture in addition to fiber bridging of the crack and fiber pullout that help hold the crack together to reduce crack width and crack propagation, scale bar 100 μm 200×.
