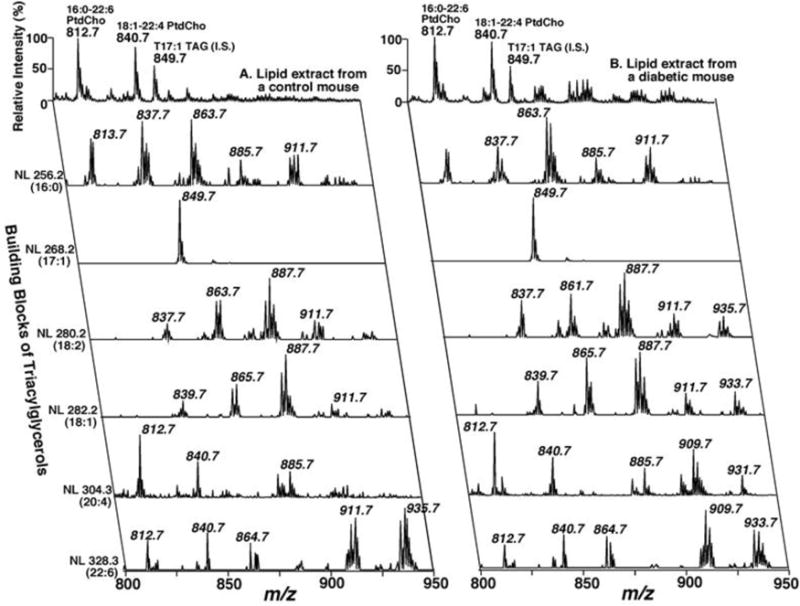
Figure 2. Positive Ion 2D Mass Spectra from Control and Diabetic Mouse Myocardium.

Triacylglycerol molecular species analyses by two-dimensional electrospray ionization mass spectrometry. The top trace is the molecular ion scan of myocardial lipid extracts from control or diabetic mice using Li+ as the adduct ion. The first-dimension spectra (top trace) were obtained in the positive-ion mode using intrasource separation. Next, neutral loss (NL) scanning of all naturally occurring aliphatic chains in triglycerides of myocardial chloroform extracts of control (left panel) or diabetic mice (right panel) were utilized to identify the molecular species assignments and quantify individual triacylglycerol molecular species by comparisons with selected internal standards. For tandem mass spectrometry in the positive-ion neutral loss (NL) mode, both the first and third quadrupoles were coordinately scanned with a mass difference (i.e., neutral loss) corresponding to the neutral loss of a nonesterified fatty acid from TAG molecular species. All mass spectral traces were displayed after normalization to the base peak in the individual spectrum.
(Biochemistry 2005 Nov24; 44:16684–16694, 10.1021/bi051908a)
