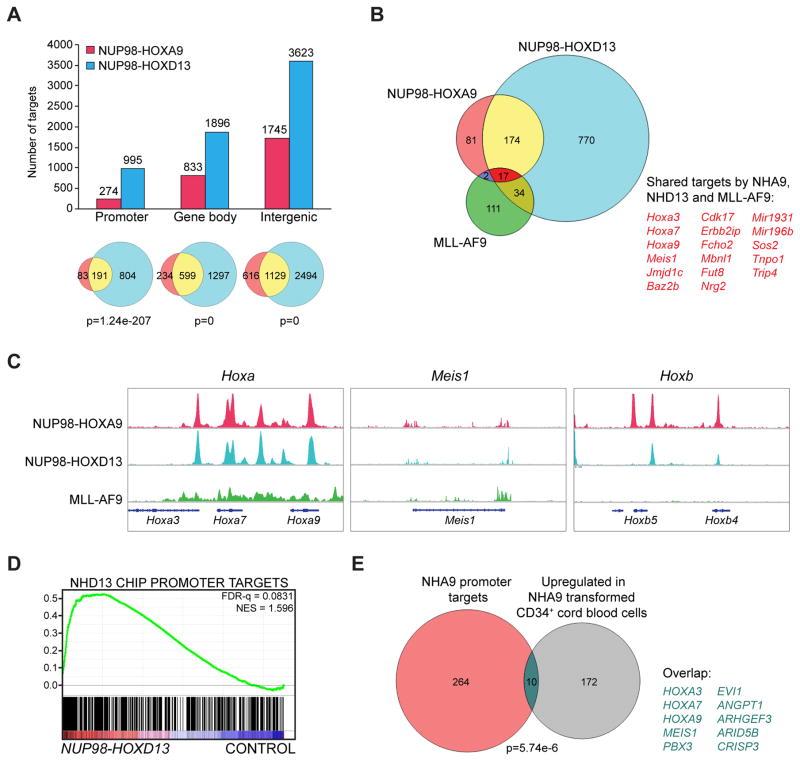
Figure 3. Genome-wide binding of NUP98 fusions in immortalized mouse bone marrow cells and functional correlation of their target genes in mouse and human cells.
(A) Mapping of NHA9 and NHD13 ChIP-seq data identified binding sites as shown in the bar graph. The Venn diagrams illustrate overlapped targets (yellow) between NHA9 (blue) and NHD13 (red) among different genomic regions with a p value calculated by hypergeometric test.
(B) Venn diagram for overlap of NHA9 (red), NHD13 (blue) and previously published MLL-AF9 (green) binding sites at promoter regions. (C) Genome browser tracks representing the shared binding sites of NHA9, NHD13 and MLL-AF9 at the Hoxa cluster loci, the Meis1 locus, and the unique binding of NHA9 and NHD13 at the Hoxb cluster loci. (D) Gene set enrichment analysis (GSEA) illustrates enrichment of NHD13 promoter region binding targets in a published gene expression microarray dataset. NES, normalized enrichment score; FDR, false discovery rate. (E) Venn diagram showing the overlap between NHA9 promoter targets (red) and the upregulated genes in a published gene expression microarray dataset (grey) with a p value calculated by hypergeometric test. See also Figure S2/Table S1.

