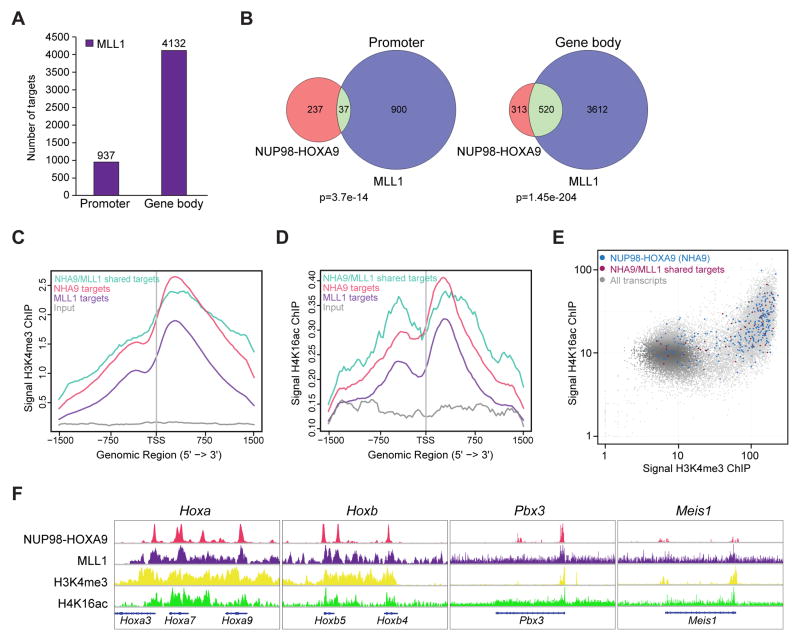
Figure 4. Colocalization of NHA9 and MLL1 at Hoxa and Hoxb cluster gene loci.
(A) The bar graph indicates the number of MLL1-bound targets defined by MLL1 ChIP-seq at promoter and gene body regions in transformed murine NHA9 LSKs.
(B) Venn diagram shows the overlap between NHA9 (red) and MLL1 (purple) binding targets at promoter and gene body regions with a p value calculated using the hypergeometric test. (C) Shown are the average binding profiles of H3K4me3 defined by H3K4me3 ChIP-seq at a region of ±1.5 kb around the annotated TSSs of NHA9-bound (red), MLL1-bound (purple) and NHA9/MLL1 co-bound targets (turquoise). Tag densities were normalized to the input (grey). (D) Average binding profiles of H4K16ac defined by H4K16ac ChIP-seq experiments are shown. (E) Genome-wide representation of the relation between H3K4me3 and H4K16ac in NHA9 cells at NHA9 promoter targets (blue) and NHA9/MLL1 co-bound promoter targets (dark red) compared to all ~34000 transcripts (gray). The x and y-axis represent binding read numbers per Kb. (F) Genome browser tracks of genomic regions showing colocalization of NHA9, MLL1, H3K4me3 and H4K16ac at four representative, well-known MLL1 targets; Hoxa cluster genes, Hoxb cluster genes, Pbx3 and Meis1. See also Figure S2/Table S2.

