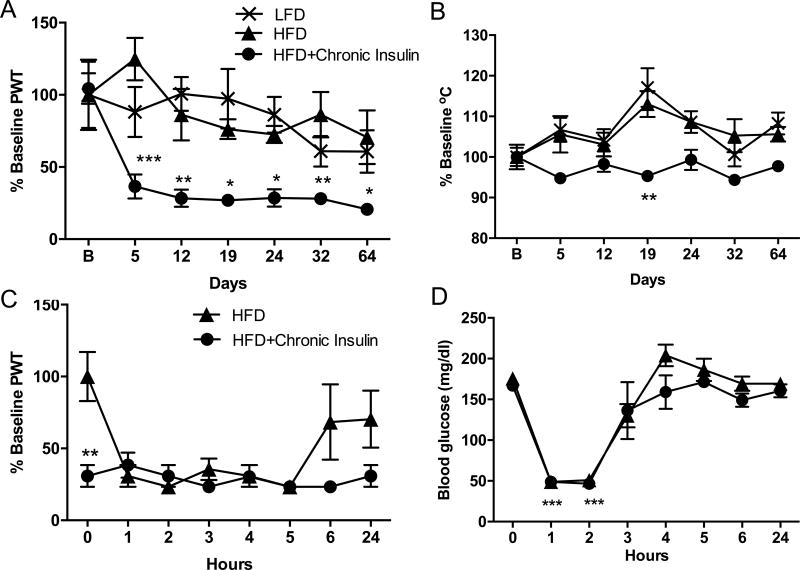
Figure 2. Daily insulin injection induces persistent allodynia.
(A) Tactile responses to von Frey filaments 5–6 hrs after the last injection for mice fed a low fat diet (LFD), a high fat diet (HFD) or a HFD and receiving daily 1U insulin injection sc (HFD+Chronic Insulin). Two-way repeated measures ANOVA followed by Sidak’s post-hoc test versus HFD group, *p<0.05, **p<0.01***p<0.001, n=4–6. (B) Responses to thermal stimulation 6–7 hrs after the last injection for mice fed a low fat diet (LFD), a high fat diet (HFD) or a HFD and receiving daily 1U insulin injection sc (HFD+Chronic Insulin). Two-way repeated measures ANOVA followed by Sidak’s post-hoc test versus HFD group, *p<0.05, **p<0.01***p<0.001, n=4–6. B: Baseline, Day 5 to Day 32, measurements were performed 5–7hrs after insulin injection while Day 64, tactile and thermal responses were assessed 72 hrs after the last insulin injection. (C) Time course of tactile responses on day 60 after injection of 1U insulin to previously untreated HFD mice (HFD) and to HFD receiving daily insulin injection for the past 59 days (HFD+Chronic Insulin). Twoway repeated measures ANOVA followed by Sidak’s post-hoc test, ** p<0.01 chronic vs HFD, n=6 (D) Blood glucose levels on day 60 after injection of 1U insulin to previously untreated HFD mice (HFD) and to HFD receiving daily insulin injection for the past 59 days (HFD+Chronic Insulin). Two-way repeated measures ANOVA followed by Tukey’s post-hoc test, ***p<0.001 vs baseline, n=6. Mean±s.e.m.

