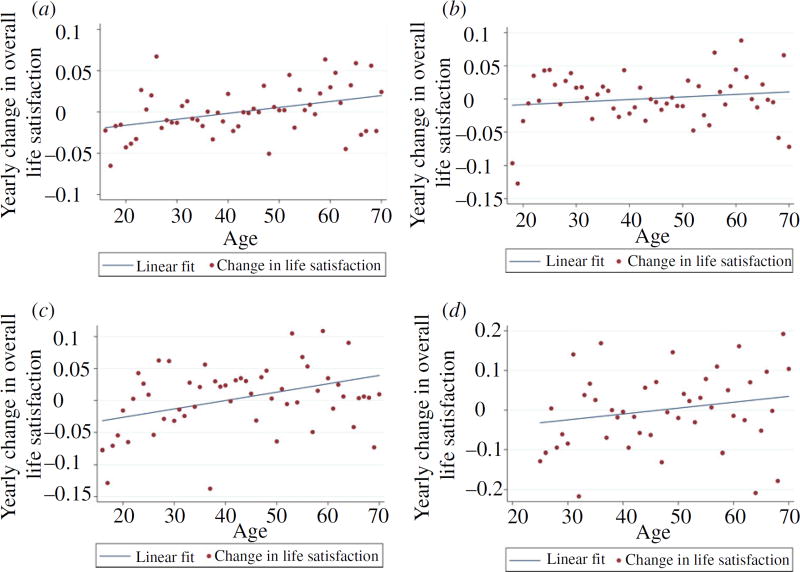
Fig. 3.
New Longitudinal Evidence: The Gradient of the Change in Life Satisfaction by Age (a) BHPS data for Great Britain (b) SOEP data for Germany (c) HILDA data for Australia (d) MABEL data for Australia
Notes. Each dot measures the mean change in life satisfaction of individuals of that particular age. The gradients of the first three best-fitting lines are individually significantly different from zero, using a two-tailed t test, at the 99% confidence level. The fourth, for MABEL, is significantly different from zero at the 90% confidence level. In each case, the change in life satisfaction passes through zero (on the y-axis) when people are in midlife (on the x-axis). This is consistent with, and exactly corresponds to, U-shaped life satisfaction across the ages of individuals in the random population samples. To read these diagrams, it is valuable to bear in mind that to the left of midlife the change in life satisfaction is negative (i.e. life satisfaction is dropping).

