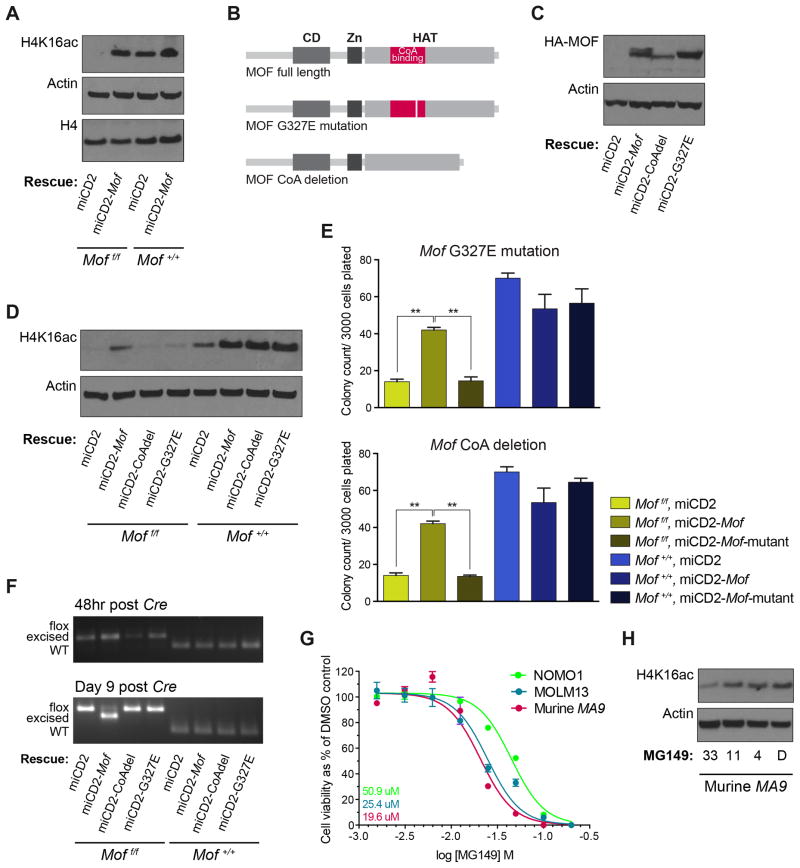
Figure 5. Mof histone acetyltransferase activity is required for colony formation of MLL-AF9 transformed mouse LSKs.
(A) MA9 in vitro transformed Moff/f or Mof+/+ LSKs were infected with full-length Mof or empty vector control (miCD2) and selected by sorting hCD2 positive cells. Cells were then infected with dTomato-Cre, 48 hours later sorted and another 24 hours later harvested. Western blot was performed on whole protein lysates.
(B) Schematic illustrating full length Mof and two Mof mutants with either a G327E point mutation or a CoA binding-site deletion.
(C) MA9 in vitro transformed Moff/f or Mof+/+ LSKs were infected with HA-tagged full-length Mof, CoA deleted Mof (CoAdel), Mof with a G327E mutation or empty vector control, and selected by sorting hCD2 positive cells. Western blot for HA confirms presence of these exogenous constructs.
(D) Cells were infected with dTomato-Cre and 48 hours later sorted and harvested. Western blot illustrates global H4K16ac and Actin in protein lysates.
(E) Day seven of CFU assay. Cells were plated immediately upon sorting dTomato positive cells, 48 hours after infection with dTomato-Cre. Bar graph indicates mean number of colonies per 35mm dish after seven days. Data are representative of three individual experiments.
(F) PCR analysis illustrating excision throughout the duration of the 7-day colony-forming experiment. Representative gel images are shown.
(G) MOLM13, NOMO1 and murine polyclonal MA9 cells were plated in liquid culture and treated with various concentrations of MG149. Plotted is the IC50 curve for cell viability as a percentage of the vehicle (DMSO) control at day three of treatment. Numbers indicate the IC50 per cell type (by color).
(H) Western blot showing global H4K16ac and Actin in murine MA9 cells after three days of MG149 treatment at various concentrations.
** p < 0.01. Error bars represent SD of mean.

