Fig. 2.

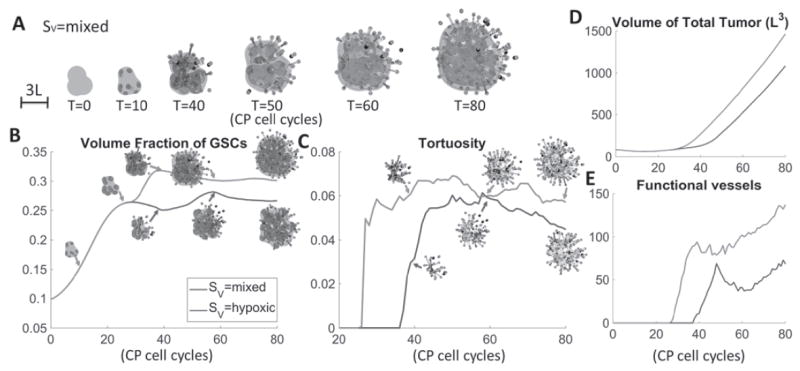
VEGF sources affect tumor and vasculature characteristics. (A) Time evolution of tumor with mixed VEGF production, i.e. SV = pVH(ñ – n)(φT – φD) + pV (φSC + φCP) Blue: tumor boundary; red: GSCs; green: GCPs. Red dots: sprout initiation points; grey: sprouts, blue: functional vessels. (B) Time evolution of GSC fractions; (C) vessel tortuosity; (D) total tumor volume and (E) numbers of functional vessels with indicated VEGF sources. Insets in (B) show GSCs (red) in the tumor (blue). Insets in (C) show the vessel network. When GSC/GCPs produce twice as much VEGF as other cells (red curves), the tumor has larger size, GSC fraction and more spherical shape. The vessels are generated earlier and more tortuous. At late stages, vessel crushing takes place in all tumors leading to saturation in vessel tortuosity.
